|
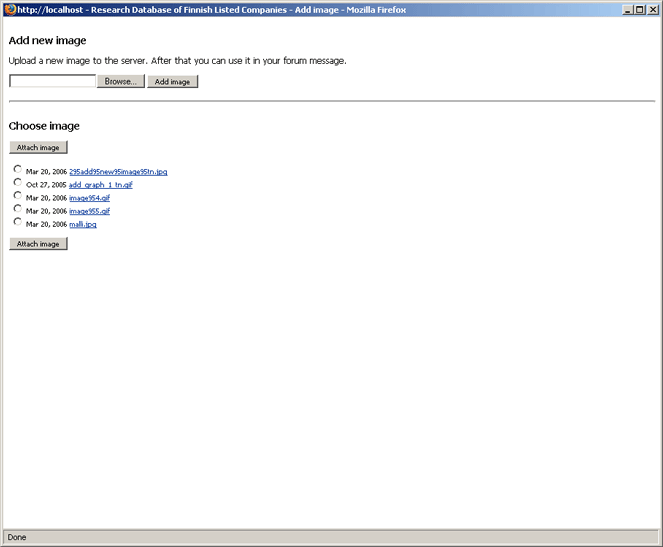
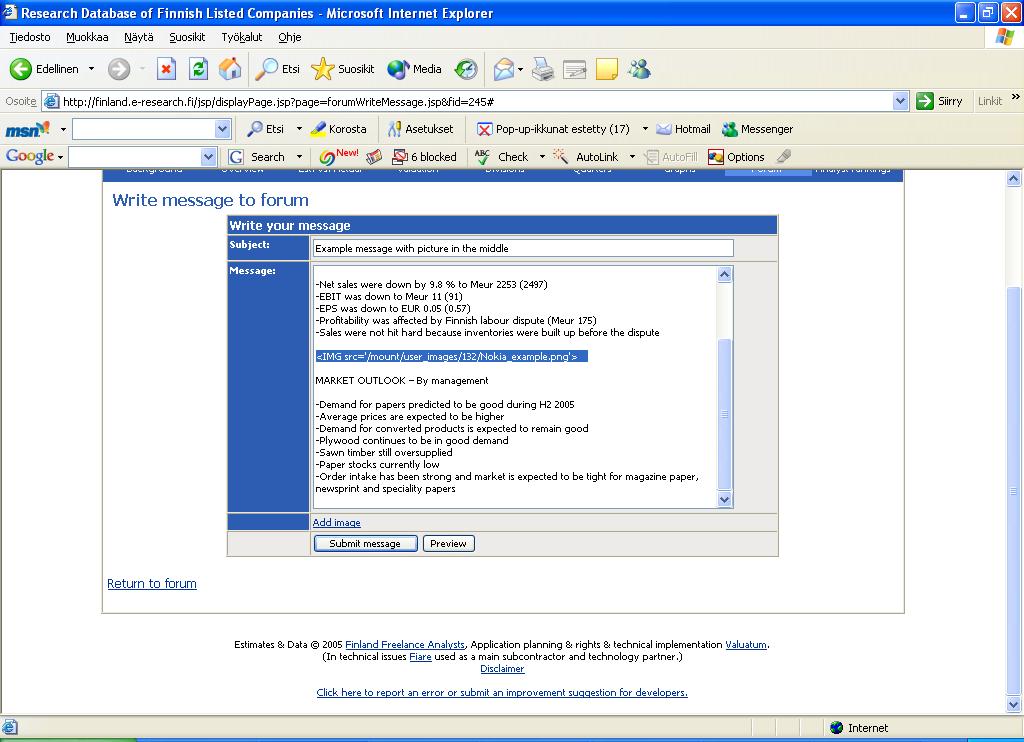
Adding ready-made graphs from company views pages
is fast and easy.
1. Click "Add graph" (picture
1) and a new window will open (picture 2).
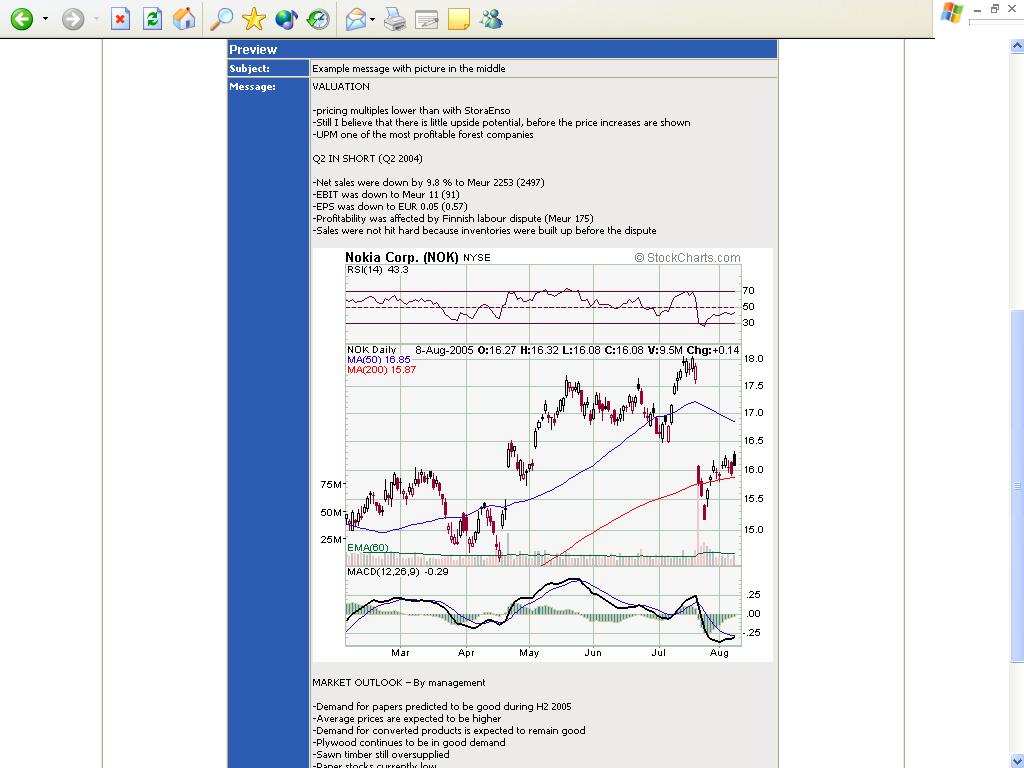
2. Select a language and a page,
where the graph is located and click "View"
(picture 2).
3. Select static or dynamic graph* (picture
3)
4. Click a graph to attach it to your comment
(picture 3). The graph is attached and you can click
another graph.
5. Click Close window button when you have
attached all the graphs you wanted.
*Difference between static and dynamic graph
Dynamic graph means that the graph will change
as your estimates change. Static graph means that
the graph will not change anymore no matter how
your estimate data will change. We recommend the
static option as the dynamic graph might lead into
a situation where your forum text would tell a different
story than your graph as the data would have changed
afterwards.
|

Picture 1- Click picture for full-size.
Picture 2- Click picture for full-size.
Picture 3- Click picture for full-size.
|