|
As there are many alternative ways or “paths”
to forecast certain parameters, it helps when you know
which forecasting variables are dominating in the model.
(Although in many cases the dominance can be quite logical,
so you can quite easily guess what we have chosen as the
dominating forecast variable.)
The following two examples illustrate how these dominating/dominated
variables work:
This are the ways the model works in case of net
sales:
1. You can forecast next year´s Net
sales with a growth percentage (growth
percentage dominating)
Let us say that you have the following forecasts:

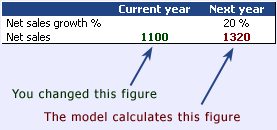
When you change your current year net sales forecast
(1000) for example to 1100, either the next year net
sales or its growth rate must change correspondingly.
As we have defined the growth rate to be dominating,
next years´ net sales also raises to 1320 due to your
forecast change in current year. This is demonstrated
below:

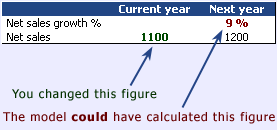
2. You can forecast
next year´s Net sales with absolute Net sales
as the dominating path.
In this case the previous change
would have meant this:

Notice: this
is not how the model actually works in a case of net
sales. It is just an example for you so it would be
easier to understand the logic of dominating variables.
In the next table, we will show you every forecasting
path with their dominating variables. Notice that also
dominated variables can be changed.
|


