ValuViews
ValuViews are a comprehensive set of web-pages
consisting of wide range of equity analysis information,
updated market data and estimates as well as history data
used e.g. for comparison and rating purposes.
The tables and graphs shown in the demo version (links
below) are just one example of what figures to present.
Stockbroker or independent equity research provider
can choose what information to show in the pages,
possible figures are the one (those 9000/company) that
can be taken from the database. Also when the broker would
like to change e.g. a graph or table, the pages with the
new kind of graphs and tables are available immediately
after one hour.
As an extremely user-friendly web-product, ValuViews
provides its users with a neat and compact package of
all information needed for conducting a professional analysis
of equity investments.
ValuViews consist of the following four main elements:
(Click
to see a sitemap of ValuViews)
|

|
Eight pages for each analysed company:
|
|

|
- Background information with company description
and ownership data
- Overview information with key financials
and figures and pricing data
- Quarter graphs about estimates versus actual
figures
- DCF and EVA valuation page
- Detailed divisional sales and earnings data
- Detailed quarter earnings data
- Graphs of most important key figures
- Company-specific forum where analyst tells
about her estimates and investors can ask questions
Figures are calculated every day with the current
share prices and Company Views pages are created
every night. Click picture to go to demo-pages
|
|

|
Four pages for each sector:
|
|
|
- Overview information with key financials
and figures and pricing data
- Detailed sales and earnings data of
companies in sector
- Detailed quarter earnings data
- Graphs of most important key figures
Sector Views pages are created every day. Click
picture to go to demo.
|
|

|
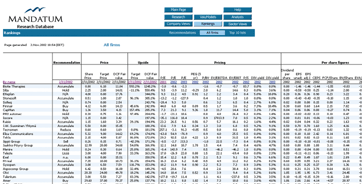
Several pages of "All companies" lists:
|
|
|
- Rankings lists in terms of various key
ratios, like P/E, ROE% etc.
- Multi-Criteria Rankings where users can
also themselves set criteria (and weight factors
for each of them) and make own ranking lists based
on those queries. Compared to (single) Rankings
pages, in these pages companies are sorted according
multiple criteria.
- Valuation
Scatter where undervalued companies are
also graphically sorted out of the whole population.
- Graphs pages makes it easy and fast to
browse different graphs like EVA/MVA, ROI/ROE
from different companies (or to look how estimates
or recommendations have "hit" with different
companies)
- Most recent stock recommendations with
related stock price information
- Collection of companies ranked according
to certain set of key figures
- All companies forum includes all recent
company forum messages
Rankings pages are created every day. Click
picture to go to demo-pages.
|

|
|

|
Customized search of company reports written by
analysts of stockbroker houses. The reports can
be read with Acrobat Reader.
|
|


