|
5. Historical values - income statement
|
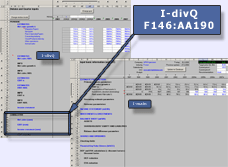
Historical income statement figures are mainly
entered to the cumulative
section of the I-divQ sheet.
The section can be found at the end of the sheet
and there you should enter historical values for
net sales, EBIT, depreciation, taxes etc.
|

Click picture for full-size map.
|
Formula in a cell?
If some of the current year quarters have already actualized,
you can see a formula in a cell that is in blue font.
The formula doesn't matter, you can override it. (See
the colour codes in Excel manual.)
Tip: You can use Info
fields for following whether the periodic figures
match after entering cumulative ones.
Possible problems?
 Net
sales is in division level but EBIT is in group level. Net
sales is in division level but EBIT is in group level.
 Quarterly
information is not available. Quarterly
information is not available.
 Associated
companies' profit is reported before EBIT. Associated
companies' profit is reported before EBIT.
 What
to do if company tells nothing about taxes? What
to do if company tells nothing about taxes?
 What
to do if company does not report depreciation? What
to do if company does not report depreciation?
 How
much history data should I fill at minimum? How
much history data should I fill at minimum?
Income statement values in I-main (secondary)
|
The full-year income statement in I-divQ is not
as specific as the one in I-main.
If it were, it would for example mean that there
were 16 financial item cells for one year (4 quarters
x 4 items) in I-divQ.
That's why we have made some compromises here;
quarter-level income statement (in I-divQ) excludes
some items that exist in full-year level (in I-main).
|

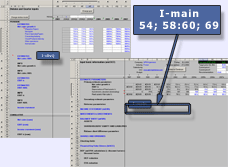
Click picture for full-size map.
|
The items that exist only in full-year level (in I-main
sheet) are:
 Goodwill
amortization (row 54) Goodwill
amortization (row 54)
 Net
financial items splitted in four sub-items (rows 57-60) Net
financial items splitted in four sub-items (rows 57-60)
 Other
income statement items (row 69) Other
income statement items (row 69)
|


