These are sample pages! In real pages data is updated every day.
Valuatum main web page
Research Database
Sector Views :
Engineering
Estimates updated
Price updated
Page generated
between 18.Jul.2003 21:16 (EEST)
between 28.Oct.2003 22:55 (EET)
7.Nov.2003 04:02 (EET)
and 5.Nov.2003 09:30 (EET)
and 6.Nov.2003 22:59 (EET)
-Sector-
Pulp & Paper
Engineering
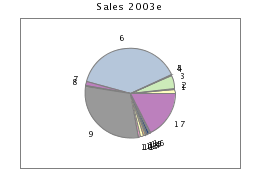
Sales per company
2000
2001
2002
2003e
2004e
2005e
1. Componenta
225.7
193.8
180.8
176.2
184.1
190.2
2. Elecster
24.1
29.3
37.6
43.2
48.4
53.2
3. KCI Konecranes
703.0
756.3
713.6
677.8
722.2
776.8
4. Kasola
18.4
15.5
10.6
9.6
9.8
10.1
5. Kesla
20.3
17.8
18.3
17.7
18.4
19.1
6. Kone
2602.4
2816.3
4341.8
5398.5
5711.1
6016.3
7. Kyro
117.3
147.0
144.3
224.5
231.5
241.8
8. Larox
55.4
67.0
59.2
55.8
57.5
60.3
9. Metso
3891.0
4343.0
4691.0
4175.0
4295.9
4467.3
10. Nordic Aluminium
90.9
86.4
78.1
72.9
75.7
78.6
11. Ponsse
119.3
123.8
133.2
163.5
171.7
180.3
12. Raute
136.2
136.1
88.9
84.4
95.2
98.8
13. Rocla
69.1
87.5
89.5
82.1
86.4
90.9
14. Suomen Helasto
25.3
25.5
24.5
24.4
25.1
26.0
15. Tamfelt
123.9
130.5
126.2
124.0
131.4
138.0
16. Vaahto Group
48.4
80.5
65.8
64.4
65.7
67.7
17. Wärtsilä
2706.8
2358.7
2519.0
2400.4
2491.6
2612.9
Total
10977.5
11415.1
13322.4
13794.2
14421.7
15128.3
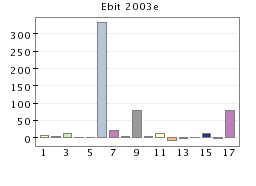
Ebit per company
2000
2001
2002
2003e
2004e
2005e
(Ebit margin)
1. Componenta
14.5
8.3
7.0
7.8
10.2
11.4
6.4%
4.3%
3.9%
4.4%
5.6%
6.0%
2. Elecster
3.0
3.3
4.5
5.2
5.8
5.3
12.3%
11.2%
12.1%
12.0%
12.0%
10.0%
3. KCI Konecranes
39.6
55.3
37.6
12.9
44.9
59.3
5.6%
7.3%
5.3%
1.9%
6.2%
7.6%
4. Kasola
1.3
0.0
0.2
0.0
0.5
0.7
7.1%
0.0%
2.0%
0.2%
4.7%
6.4%
5. Kesla
-0.4
0.6
1.2
0.6
1.0
0.8
-1.9%
3.3%
6.5%
3.4%
5.5%
4.0%
6. Kone
186.3
217.8
275.2
332.0
380.0
417.8
7.2%
7.7%
6.3%
6.1%
6.7%
6.9%
7. Kyro
16.4
17.2
18.7
20.8
24.0
27.4
14.0%
11.7%
13.0%
9.3%
10.4%
11.3%
8. Larox
5.6
5.7
2.1
4.9
5.2
5.4
10.0%
8.4%
3.6%
8.8%
9.0%
9.0%
9. Metso
200.1
203.9
160.0
78.7
138.3
207.1
5.1%
4.7%
3.4%
1.9%
3.2%
4.6%
10. Nordic Aluminium
6.9
2.9
2.5
3.9
5.4
5.7
7.6%
3.3%
3.2%
5.4%
7.2%
7.2%
11. Ponsse
12.5
9.7
9.4
12.4
14.6
16.2
10.5%
7.9%
7.0%
7.6%
8.5%
9.0%
12. Raute
4.5
7.5
-8.3
-6.7
2.9
3.7
3.3%
5.5%
-9.3%
-8.0%
3.1%
3.8%
13. Rocla
5.1
5.0
0.7
-0.9
3.5
5.5
7.4%
5.7%
0.8%
-1.0%
4.1%
6.0%
14. Suomen Helasto
2.1
1.6
1.0
1.1
1.4
1.6
8.2%
6.4%
3.9%
4.5%
5.5%
6.0%
15. Tamfelt
22.4
22.7
16.1
13.2
19.7
23.5
18.0%
17.4%
12.8%
10.6%
15.0%
17.0%
16. Vaahto Group
1.0
2.1
-0.6
-1.0
1.3
2.0
2.1%
2.6%
-0.9%
-1.6%
2.0%
3.0%
17. Wärtsilä
367.1
523.9
188.9
78.8
127.3
172.8
13.6%
22.2%
7.5%
3.3%
5.1%
6.6%
Total
887.9
1087.3
716.2
563.7
785.9
966.2
8.1%
9.5%
5.4%
4.1%
5.4%
6.4%
Sales growth
2000
2001
2002
2003e
2004e
2005e
1. Componenta
-15.3%
-14.1%
-6.7%
-2.6%
4.5%
3.3%
2. Elecster
57.3%
21.6%
28.2%
15.0%
12.0%
10.0%
3. KCI Konecranes
18.9%
7.6%
-5.7%
-5.0%
6.6%
7.5%
4. Kasola
17.6%
-15.6%
-31.6%
-9.8%
2.7%
3.0%
5. Kesla
-0.5%
-12.5%
2.8%
-3.4%
4.0%
4.0%
6. Kone
7.9%
8.2%
54.2%
24.3%
5.8%
5.3%
7. Kyro
18.5%
25.3%
-1.8%
55.6%
3.1%
4.5%
8. Larox
20.1%
20.9%
-11.6%
-5.8%
3.0%
5.0%
9. Metso
14.9%
11.6%
8.0%
-11.0%
2.9%
4.0%
10. Nordic Aluminium
28.9%
-4.9%
-9.6%
-6.7%
3.9%
3.9%
11. Ponsse
0.7%
3.8%
7.5%
22.8%
5.0%
5.0%
12. Raute
50.6%
-0.0%
-34.7%
-5.1%
12.9%
3.7%
13. Rocla
32.1%
26.7%
2.3%
-8.3%
5.2%
5.2%
14. Suomen Helasto
8.2%
0.8%
-4.0%
-0.3%
3.0%
3.5%
15. Tamfelt
12.8%
5.3%
-3.3%
-1.8%
6.0%
5.0%
16. Vaahto Group
8.6%
66.2%
-18.2%
-2.2%
2.0%
3.0%
17. Wärtsilä
0.3%
-12.9%
6.8%
-4.7%
3.8%
4.9%
Total
9.1%
4.0%
16.7%
3.5%
4.5%
4.9%
Growth in Ebit
2000
2001
2002
2003e
2004e
2005e
1. Componenta
-12.8%
-42.6%
-15.6%
11.7%
30.9%
11.5%
2. Elecster
144.3%
11.2%
38.1%
14.3%
12.0%
-8.3%
3. KCI Konecranes
23.4%
39.5%
-32.0%
-65.6%
246.8%
32.2%
4. Kasola
139.5%
-100.0%
0.0%
-91.2%
2407.8%
40.6%
5. Kesla
-117.5%
-256.3%
102.0%
-49.0%
66.6%
-24.4%
6. Kone
58.3%
16.9%
26.4%
20.6%
14.5%
10.0%
7. Kyro
65.7%
4.7%
8.9%
11.1%
15.4%
14.2%
8. Larox
57.4%
1.8%
-62.2%
129.6%
5.4%
5.0%
9. Metso
-2101.0%
1.9%
-21.5%
-50.8%
75.7%
49.8%
10. Nordic Aluminium
14.8%
-58.1%
-14.2%
57.4%
38.8%
5.0%
11. Ponsse
65.9%
-22.4%
-3.5%
32.4%
17.5%
11.2%
12. Raute
-432.7%
67.0%
-210.9%
-19.1%
-143.5%
27.8%
13. Rocla
7.6%
-3.0%
-85.9%
-222.5%
-508.2%
57.1%
14. Suomen Helasto
124.4%
-21.7%
-41.6%
15.1%
26.3%
12.9%
15. Tamfelt
12.0%
1.6%
-29.1%
-18.2%
49.6%
19.0%
16. Vaahto Group
-6.7%
105.1%
-126.9%
85.3%
-225.8%
54.5%
17. Wärtsilä
34.6%
42.7%
-63.9%
-58.3%
61.6%
35.7%
Total
82.9%
22.5%
-34.1%
-21.3%
39.4%
22.9%