These are sample pages! In real pages data is updated every day.
Valuatum main web page
Research Database
Sector Views :
Engineering
Estimates updated
Price updated
Page generated
between 18.Jul.2003 21:16 (EEST)
between 28.Oct.2003 22:55 (EET)
7.Nov.2003 04:02 (EET)
and 5.Nov.2003 09:30 (EET)
and 6.Nov.2003 22:59 (EET)
-Sector-
Pulp & Paper
Engineering
Income statement
2000
2001
2002
2003e
2004e
2005e
Turnover
10977.5
11415.1
13322.4
13794.2
14421.7
15128.3
EBITDA
1256.0
1498.9
1215.6
1090.2
1308.5
1502.9
EBIT
887.9
1087.3
716.2
563.7
785.9
966.2
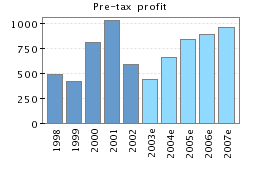
Pre-tax profit
810.5
1034.4
589.0
436.7
654.8
837.9
Reported earnings
538.5
662.3
391.4
271.0
396.1
518.4
Free cash flow
1023.4
-450.3
-1078.0
492.8
413.3
672.9
Balance sheet
2000
2001
2002
2003e
2004e
2005e
Fixed assets
2591.7
2562.8
3169.5
2990.3
3065.8
3110.5
Current assets
5906.9
6810.4
7025.9
6625.4
6903.1
7177.9
Interest-bearing assets
1058.6
1067.2
1027.9
678.9
706.6
734.4
Shareholders' equity
3518.6
3982.6
4071.1
3604.0
3785.4
4065.9
Interest bearing debt
1805.5
2516.9
3957.3
3582.3
3498.7
3182.1
Total assets
9263.0
10981.6
12578.0
11672.8
11855.8
12004.2
Net debt
746.8
1449.7
2929.4
2903.4
2798.1
2453.8
Key figures
2000
2001
2002
2003e
2004e
2005e
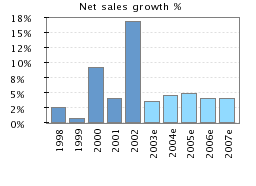
Turnover growth %
9.1%
4.0%
16.7%
3.5%
4.5%
4.9%
EBITDA %
11.4%
13.1%
9.1%
7.9%
9.1%
9.9%
EBIT %
8.1%
9.5%
5.4%
4.1%
5.4%
6.4%
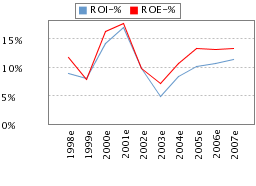
ROE %
16.3%
17.7%
9.7%
7.1%
10.7%
13.2%
ROI %
18.6%
20.5%
11.3%
8.7%
11.8%
14.2%
Equity ratio
38.0%
36.3%
32.4%
30.9%
31.9%
33.9%
Gearing
21.2%
36.4%
72.0%
80.6%
73.9%
60.4%
Return vs. cost of capital
2000
2001
2002
2003e
2004e
2005e
ROC %
13.4%
14.7%
13.6%
5.3%
8.5%
10.2%
WACC %
7.7%
7.7%
7.7%
7.7%
7.7%
7.7%
Excess return
6.1%
7.0%
5.9%
-2.4%
0.7%
2.5%
Capital employed
4265.4
5432.3
7000.5
6507.4
6583.5
6519.7
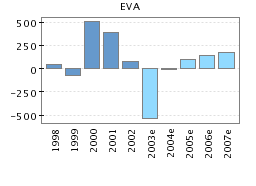
EVA - Economic value added
502.8
389.0
74.6
-532.3
-12.9
101.2
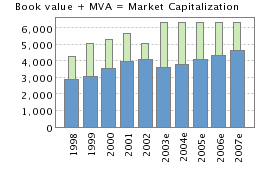
MVA - Market value added
1766.1
1654.6
973.5
2730.7
2549.3
2269.4
EVA / MVA
28.5%
23.5%
7.7%
-19.5%
-0.5%
4.5%
Pricing and key ratios
2000
2001
2002
2003e
2004e
2005e
Market Cap
5284.7
5637.2
5044.6
6340.4
6340.4
6340.4
EV
6031.5
7086.8
7974.0
9238.1
9132.8
8789.1
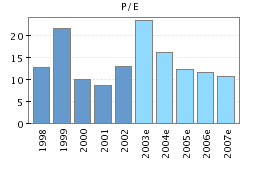
P/E
9.8
8.5
12.9
23.4
16.0
12.2
P/FCF
5.2
-12.5
-4.7
12.9
15.3
9.4
P/BV
1.6
1.4
1.3
1.8
1.7
1.6
P/S
0.5
0.5
0.4
0.5
0.4
0.4
EV/EBIT
6.8
6.5
11.1
16.4
11.6
9.1
EV/EBITDA
4.8
4.7
6.6
8.5
7.0
5.8
Div. yield %
5.8%
7.5%
6.6%
3.4%
3.7%
4.2%