These are sample pages! In real pages data is updated every day.
Valuatum main web page
Research Database
MEO1V.HSE
Recommendation
Reduce
Risk
-
Target price
8.5
Share price
9.58
Company Views -
Metso
Estimates updated
Price updated
Page generated
Older estimates
30.Oct.2003 06:08 (EET)
6.Nov.2003 22:40 (EET)
7.Nov.2003 03:00 (EET)
-Company-
Nokia
Stora Enso
UPM-Kymmene
Metso
Analyst: Henry Nurminen, +358 10 236 4709
henry.nurminen@mandatum.fi
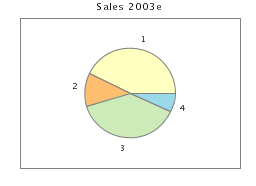
Sales per division
2000
2001
2002
2003e
2004e
2005e
1. Metso Paper
2286.0
2383.0
1972.0
1823.0
1895.9
1971.8
2. Metso Automation
644.0
693.0
622.0
508.0
513.1
533.6
3. Metso Minerals
0.0
913.0
1819.0
1632.0
1672.8
1739.7
4. Metso Ventures
0.0
489.0
374.0
295.0
297.9
306.9
5. Machinery
1038.0
0.0
0.0
0.0
0.0
0.0
7. Intra-group sales
-77.0
-135.0
-96.0
-83.0
-83.8
-84.7
Total
3891.0
4343.0
4691.0
4175.0
4295.9
4467.3
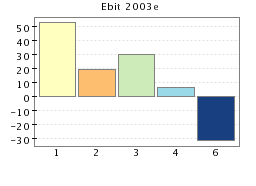
Ebit per division
2000
2001
2002
2003e
2004e
2005e
(Ebit margin)
1. Metso Paper
106.4
170.6
109.3
52.9
87.2
122.2
4.7%
7.2%
5.5%
2.9%
4.6%
6.2%
2. Metso Automation
45.0
17.3
16.3
19.8
20.5
22.4
7.0%
2.5%
2.6%
3.9%
4.0%
4.2%
3. Metso Minerals
0.0
14.7
51.4
30.5
51.9
78.3
0.0%
1.6%
2.8%
1.9%
3.1%
4.5%
4. Metso Ventures
0.0
28.2
14.9
6.7
10.7
17.2
0.0%
5.8%
4.0%
2.3%
3.6%
5.6%
5. Machinery
67.3
0.0
0.0
0.0
0.0
0.0
6.5%
0.0%
0.0%
0.0%
0.0%
0.0%
6. Metso HQ and others
-18.6
-26.9
-31.9
-31.1
-32.0
-33.0
0.0%
0.0%
-
0.0%
0.0%
0.0%
Total
200.1
203.9
160.0
78.7
138.3
207.1
5.1%
4.7%
3.4%
1.9%
3.2%
4.6%
Sales growth
2000
2001
2002
2003e
2004e
2005e
1. Metso Paper
33.6%
4.2%
-17.2%
-7.6%
4.0%
4.0%
2. Metso Automation
7.5%
7.6%
-10.2%
-18.3%
1.0%
4.0%
3. Metso Minerals
0.0%
0.0%
99.2%
-10.3%
2.5%
4.0%
4. Metso Ventures
0.0%
0.0%
-23.5%
-21.1%
1.0%
3.0%
5. Machinery
-10.1%
-100.0%
0.0%
0.0%
0.0%
0.0%
7. Intra-group sales
-1.3%
75.3%
-28.9%
-13.5%
1.0%
1.0%
Total
14.9%
11.6%
8.0%
-11.0%
2.9%
4.0%
Growth in Ebit
2000
2001
2002
2003e
2004e
2005e
1. Metso Paper
-241.5%
60.3%
-35.9%
-51.6%
64.9%
40.2%
2. Metso Automation
650.0%
-61.6%
-5.8%
21.5%
3.7%
9.2%
3. Metso Minerals
0.0%
0.0%
249.7%
-40.7%
70.0%
51.0%
4. Metso Ventures
0.0%
0.0%
-47.2%
-55.4%
61.3%
60.2%
5. Machinery
-13.9%
-100.0%
0.0%
0.0%
0.0%
0.0%
6. Metso HQ and others
-2.1%
44.6%
18.6%
-2.5%
3.0%
3.0%
Total
-2101.0%
1.9%
-21.5%
-50.8%
75.7%
49.8%