Research Database |
| MEO1V.HSE |
Recommendation |
Reduce |
| Risk - |
Target price |
8.5
| | |
Share price |
9.58 | |
|
| Base figures |
1998 |
1999 |
2000 |
2001 |
2002 |
2003e |
2004e |
2005e |
2006e |
2007e |
2008e |
2009e |
2010e |
2011e |
2012e |
2013e |
2014e |
2015e |
2016e |
2017e |
TRM |
| |
| Net sales |
3695.0 |
3387.0 |
3891.0 |
4343.0 |
4691.0 |
4175.0 |
4295.9 |
4467.3 |
4585.2 |
4748.0 |
4914.2 |
5086.2 |
5264.2 |
5448.4 |
5639.1 |
5836.5 |
6040.8 |
6252.2 |
6471.0 |
6697.5 |
|
| EBITDA |
377.0 |
120.0 |
328.1 |
352.9 |
357.0 |
264.7 |
321.9 |
387.9 |
390.5 |
452.3 |
510.5 |
502.3 |
513.2 |
524.4 |
503.1 |
505.1 |
504.2 |
517.2 |
530.6 |
535.0 |
|
| EBIT |
246.0 |
-10.0 |
200.1 |
203.9 |
160.0 |
78.7 |
138.3 |
207.1 |
212.1 |
270.6 |
324.3 |
325.5 |
331.6 |
337.8 |
321.4 |
318.1 |
321.7 |
329.0 |
336.5 |
334.9 |
|
|
| Fixed assets |
996.0 |
982.0 |
962.0 |
1158.0 |
1110.0 |
1113.0 |
1093.4 |
1076.7 |
1099.4 |
1130.6 |
1162.5 |
1195.5 |
1229.7 |
1265.1 |
1301.7 |
1339.6 |
1378.8 |
1419.4 |
1461.4 |
1504.9 |
|
| Total equity |
1216.0 |
1094.0 |
1433.0 |
1476.0 |
1389.0 |
1011.0 |
1024.8 |
1083.0 |
1134.3 |
1214.7 |
1333.7 |
1426.8 |
1522.5 |
1604.0 |
1672.4 |
1726.1 |
1768.3 |
1790.4 |
1812.9 |
1817.7 |
|
| Int.bear. debt |
581.0 |
776.0 |
548.0 |
1568.0 |
1353.0 |
1429.7 |
1410.7 |
1319.5 |
1216.9 |
1148.0 |
1091.8 |
977.0 |
911.0 |
861.8 |
888.2 |
884.4 |
899.7 |
940.4 |
983.7 |
1047.7 |
|
| Total assets |
2798.0 |
3169.0 |
3564.0 |
5042.0 |
4399.0 |
3951.8 |
3985.2 |
4007.1 |
3993.5 |
4057.0 |
4123.0 |
4156.3 |
4243.1 |
4334.3 |
4440.0 |
4550.6 |
4676.0 |
4806.6 |
4942.4 |
5083.6 |
|
|
| Gross capex |
166.8 |
97.0 |
146.0 |
1174.0 |
7.0 |
-80.0 |
110.0 |
110.1 |
147.0 |
158.9 |
164.1 |
169.8 |
175.8 |
181.9 |
188.3 |
194.9 |
201.7 |
208.8 |
216.1 |
223.6 |
|
|
| Key Ratios |
1998 |
1999 |
2000 |
2001 |
2002 |
2003e |
2004e |
2005e |
2006e |
2007e |
2008e |
2009e |
2010e |
2011e |
2012e |
2013e |
2014e |
2015e |
2016e |
2017e |
TRM |
| |
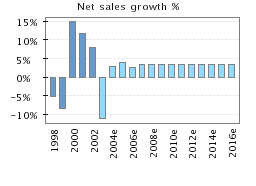
| Sales growth % |
-5.2% |
-8.3% |
14.9% |
11.6% |
8.0% |
-11.0% |
2.9% |
4.0% |
2.6% |
3.6% |
3.5% |
3.5% |
3.5% |
3.5% |
3.5% |
3.5% |
3.5% |
3.5% |
3.5% |
3.5% |
|
| EBITDA % |
10.2% |
3.5% |
8.4% |
8.1% |
7.6% |
6.3% |
7.5% |
8.7% |
8.5% |
9.5% |
10.4% |
9.9% |
9.7% |
9.6% |
8.9% |
8.7% |
8.3% |
8.3% |
8.2% |
8.0% |
|
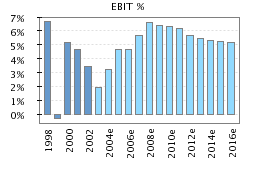
| EBIT % |
6.7% |
-0.3% |
5.1% |
4.7% |
3.4% |
1.9% |
3.2% |
4.6% |
4.6% |
5.7% |
6.6% |
6.4% |
6.3% |
6.2% |
5.7% |
5.4% |
5.3% |
5.3% |
5.2% |
5.0% |
|
| Asset turnover |
2.7 |
2.0 |
2.6 |
1.5 |
1.8 |
1.9 |
1.9 |
2.1 |
2.1 |
2.2 |
2.2 |
2.3 |
2.3 |
2.4 |
2.4 |
2.4 |
2.4 |
2.5 |
2.5 |
2.5 |
|
| ROI % |
16.9% |
1.7% |
12.2% |
9.8% |
6.1% |
3.8% |
6.4% |
9.2% |
9.3% |
11.9% |
13.9% |
13.7% |
13.8% |
13.9% |
12.9% |
12.4% |
12.3% |
12.3% |
12.3% |
12.0% |
|
| ROE % |
15.5% |
-2.3% |
9.6% |
8.0% |
4.2% |
0.6% |
4.0% |
8.1% |
8.3% |
11.5% |
13.6% |
13.0% |
12.6% |
12.3% |
11.2% |
10.7% |
10.7% |
10.7% |
10.8% |
10.6% |
|
| Equity ratio % |
43.5% |
34.5% |
40.2% |
29.3% |
31.6% |
25.6% |
25.7% |
27.0% |
28.4% |
29.9% |
32.3% |
34.3% |
35.9% |
37.0% |
37.6% |
37.9% |
37.8% |
37.2% |
36.6% |
35.8% |
|
|
| DCF Valuation |
1998 |
1999 |
2000 |
2001 |
2002 |
2003e |
2004e |
2005e |
2006e |
2007e |
2008e |
2009e |
2010e |
2011e |
2012e |
2013e |
2014e |
2015e |
2016e |
2017e |
TRM |
| |
| EBIT |
246.0 |
-10.0 |
200.1 |
203.9 |
160.0 |
78.7 |
138.3 |
207.1 |
212.1 |
270.6 |
324.3 |
325.5 |
331.6 |
337.8 |
321.4 |
318.1 |
321.7 |
329.0 |
336.5 |
334.9 |
|
| +/- Share of assoc. |
3.0 |
3.0 |
0.0 |
0.0 |
0.0 |
0.0 |
0.0 |
0.0 |
0.0 |
0.0 |
0.0 |
0.0 |
0.0 |
0.0 |
0.0 |
0.0 |
0.0 |
0.0 |
0.0 |
0.0 |
|
| - Taxes on cont. oper. |
-63.6 |
0.0 |
-59.0 |
-62.0 |
-24.0 |
-2.0 |
-42.3 |
-62.1 |
-65.1 |
-84.1 |
-101.0 |
-97.7 |
-100.4 |
-103.6 |
-95.3 |
-94.6 |
-92.7 |
-94.2 |
-95.6 |
-94.4 |
|
| - Tax, fin. expenses |
-10.7 |
0.0 |
-16.4 |
-19.4 |
-15.2 |
-2.5 |
-22.2 |
-23.1 |
-20.0 |
-18.9 |
-17.9 |
-16.6 |
-15.1 |
-14.2 |
-14.0 |
-14.2 |
-14.3 |
-14.7 |
-15.4 |
-16.3 |
|
| + Tax, fin. income |
11.1 |
0.0 |
10.4 |
12.2 |
3.4 |
0.6 |
5.2 |
4.6 |
3.1 |
2.9 |
2.4 |
1.6 |
1.0 |
1.0 |
1.0 |
1.1 |
1.1 |
1.1 |
1.2 |
1.2 |
|
|
| Operating cash flow |
185.8 |
-7.0 |
135.1 |
134.7 |
124.2 |
74.8 |
79.1 |
126.6 |
130.1 |
170.5 |
207.8 |
212.9 |
217.1 |
221.0 |
213.2 |
210.4 |
215.8 |
221.5 |
226.6 |
225.5 |
|
| + Total depreciation |
131.0 |
130.0 |
128.0 |
149.0 |
197.0 |
186.0 |
183.6 |
180.8 |
178.4 |
181.7 |
186.2 |
176.8 |
181.6 |
186.6 |
181.7 |
187.0 |
182.5 |
188.2 |
194.1 |
200.2 |
|
|
| Gross cash flow |
316.8 |
123.0 |
263.1 |
283.7 |
321.2 |
260.8 |
262.7 |
307.4 |
308.5 |
352.1 |
394.0 |
389.7 |
398.7 |
407.6 |
394.9 |
397.4 |
398.3 |
409.4 |
420.7 |
425.6 |
|
| - Ch. in working cap. |
44.8 |
-300.0 |
185.0 |
-439.0 |
121.0 |
31.0 |
-62.3 |
-29.1 |
-20.0 |
-27.7 |
-28.3 |
-29.2 |
-30.3 |
-31.3 |
-32.4 |
-33.6 |
-34.7 |
-35.9 |
-37.2 |
-38.5 |
|
| + Inc. in nib. l-t liab. |
12.9 |
-8.0 |
30.0 |
104.0 |
-31.0 |
23.0 |
0.0 |
0.0 |
0.0 |
0.0 |
-50.0 |
0.0 |
0.0 |
0.0 |
-50.0 |
0.0 |
0.0 |
0.0 |
0.0 |
0.0 |
|
| - Gross capex |
-166.8 |
-97.0 |
-146.0 |
-1174.0 |
-7.0 |
80.0 |
-110.0 |
-110.1 |
-147.0 |
-158.9 |
-164.1 |
-169.8 |
-175.8 |
-181.9 |
-188.3 |
-194.9 |
-201.7 |
-208.8 |
-216.1 |
-223.6 |
|
|
| Free oper. cash flow |
207.8 |
-282.0 |
332.1 |
-1225.3 |
404.2 |
394.8 |
90.4 |
168.1 |
141.5 |
165.6 |
151.6 |
190.6 |
192.7 |
194.3 |
124.1 |
168.9 |
161.9 |
164.7 |
167.4 |
163.5 |
|
| +/- Other items |
-3.4 |
-60.0 |
268.0 |
24.0 |
3.0 |
-303.0 |
0.0 |
0.0 |
0.0 |
0.0 |
0.0 |
0.0 |
0.0 |
0.0 |
0.0 |
0.0 |
0.0 |
0.0 |
0.0 |
0.0 |
|
|
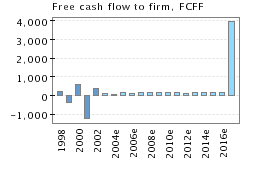
| FCFF |
204.5 |
-342.0 |
600.1 |
-1201.3 |
407.1 |
91.8 |
90.4 |
168.1 |
141.5 |
165.6 |
151.6 |
190.6 |
192.7 |
194.3 |
124.1 |
168.9 |
161.9 |
164.7 |
167.4 |
163.5 |
3949.3 |
| Disc. FCFF |
|
|
|
|
|
90.6 |
82.8 |
142.8 |
111.5 |
121.1 |
102.9 |
120.0 |
112.5 |
105.3 |
62.4 |
78.8 |
70.0 |
66.1 |
62.3 |
56.5 |
1363.4 |
|
| Cum. disc. FCFF |
|
|
|
|
|
2751.4 |
2660.7 |
2578.0 |
2435.0 |
2323.5 |
2202.3 |
2099.4 |
1979.4 |
1866.8 |
1761.3 |
1698.9 |
1619.9 |
1549.6 |
1483.4 |
1421.0 |
|
| - Int-bear. debt |
|
|
|
|
|
1429.7 |
|
|
|
|
|
|
|
|
|
|
|
|
|
|
|
| + Cash and bank |
|
|
|
|
|
208.8 |
|
|
|
|
|
|
|
|
|
|
|
|
|
|
|
| + Inv. above BV |
|
|
|
|
|
0.0 |
|
|
|
|
|
|
|
|
|
|
|
|
|
|
|
|
| Value of equity |
|
|
|
|
|
1530.3 |
|
|
|
|
|
|
|
|
|
|
|
|
|
|
|
| / No of shares |
|
|
|
|
|
136.3 |
|
|
|
|
|
|
|
|
|
|
|
|
|
|
|
| Fair value (DCF) |
|
|
|
|
|
11.22 |
|
|
|
|
|
|
|
|
|
|
|
|
|
|
|
|
| EVA Valuation |
1998 |
1999 |
2000 |
2001 |
2002 |
2003e |
2004e |
2005e |
2006e |
2007e |
2008e |
2009e |
2010e |
2011e |
2012e |
2013e |
2014e |
2015e |
2016e |
2017e |
TRM |
| |
| EBIT |
246.0 |
-10.0 |
200.1 |
203.9 |
160.0 |
78.7 |
138.3 |
207.1 |
212.1 |
270.6 |
324.3 |
325.5 |
331.6 |
337.8 |
321.4 |
318.1 |
321.7 |
329.0 |
336.5 |
334.9 |
|
| - Taxes on EBIT |
-58.6 |
0.0 |
-59.6 |
-60.8 |
-25.6 |
-2.2 |
-42.6 |
-63.8 |
-65.3 |
-83.4 |
-99.9 |
-100.3 |
-102.1 |
-104.0 |
-99.0 |
-98.0 |
-99.1 |
-101.3 |
-103.6 |
-103.1 |
|
|
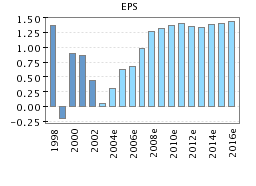
| NOPLAT |
187.4 |
-10.0 |
140.5 |
143.1 |
134.4 |
76.6 |
95.7 |
143.3 |
146.8 |
187.3 |
224.4 |
225.3 |
229.5 |
233.8 |
222.4 |
220.1 |
222.6 |
227.7 |
232.9 |
231.7 |
233.5 |
| +/- Other items |
-4.9 |
-57.0 |
262.6 |
15.6 |
-7.3 |
-304.8 |
-16.6 |
-16.6 |
-16.6 |
-16.6 |
-16.6 |
-12.3 |
-12.3 |
-12.3 |
-9.2 |
-9.2 |
-6.2 |
-6.2 |
-6.2 |
-6.2 |
|
| - Cost of capital |
-110.9 |
-111.1 |
-130.1 |
-114.7 |
-223.0 |
-198.6 |
-173.8 |
-172.9 |
-169.7 |
-168.8 |
-169.2 |
-173.6 |
-175.3 |
-177.2 |
-179.3 |
-186.2 |
-189.4 |
-193.6 |
-198.0 |
-202.7 |
-142.7 |
|
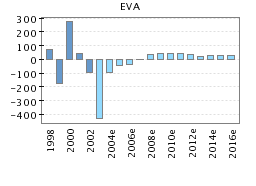
| EVA |
71.6 |
-178.1 |
273.1 |
44.0 |
-95.9 |
-426.8 |
-94.7 |
-46.2 |
-39.5 |
1.8 |
38.6 |
39.4 |
41.9 |
44.2 |
33.9 |
24.7 |
27.0 |
27.9 |
28.6 |
22.9 |
90.7 |
| PV of TRM EVA |
|
|
|
|
|
|
|
|
|
|
|
|
|
|
|
|
|
|
|
|
2116.3 |
| Disc. EVA |
|
|
|
|
|
-421.3 |
-86.8 |
-39.3 |
-31.2 |
1.3 |
26.2 |
24.8 |
24.5 |
24.0 |
17.0 |
11.5 |
11.7 |
11.2 |
10.7 |
7.9 |
731.2 |
| PV of cap. base change |
|
|
|
|
|
|
|
|
|
|
|
|
|
|
|
|
|
|
|
|
-287.3 |
|
| Cum. disc. EVA |
|
|
|
|
|
36.2 |
457.4 |
544.2 |
583.5 |
614.6 |
613.3 |
587.1 |
562.3 |
537.9 |
513.9 |
496.9 |
485.4 |
473.7 |
462.5 |
451.8 |
|
| + Capital inv. |
|
|
|
|
|
2715.2 |
|
|
|
|
|
|
|
|
|
|
|
|
|
|
|
| - Int-bear. debt |
|
|
|
|
|
1429.7 |
|
|
|
|
|
|
|
|
|
|
|
|
|
|
|
| + Cash and bank |
|
|
|
|
|
208.8 |
|
|
|
|
|
|
|
|
|
|
|
|
|
|
|
| +/- Inv. above BV |
|
|
|
|
|
0.0 |
|
|
|
|
|
|
|
|
|
|
|
|
|
|
|
|
| Value of equity |
|
|
|
|
|
1530.4 |
|
|
|
|
|
|
|
|
|
|
|
|
|
|
|
| / No of shares |
|
|
|
|
|
136.3 |
|
|
|
|
|
|
|
|
|
|
|
|
|
|
|
| Fair value (EVA) |
|
|
|
|
|
11.23 |
|
|
|
|
|
|
|
|
|
|
|
|
|
|
|
|
| Cost of capital (WACC) |
2003e |
| |
| Tax rate (WACC) % |
31.8% |
| Target D/(D+E) |
10.0% |
| Cost of debt % |
6.0% |
| Equity beta |
1.0 |
| Equity market risk premium (%-points) |
4.0% |
| Risk-free interest rate |
4.3% |
| Cost of equity |
8.2% |
| WACC % |
7.8% |
|
|
|
|