These are sample pages! In real pages data is updated every day.
Valuatum main web page
Research Database
MEO1V.HSE
Recommendation
Reduce
Risk
-
Target price
8.5
Share price
9.58
Company Views -
Metso
Estimates updated
Price updated
Page generated
Older estimates
30.Oct.2003 06:08 (EET)
6.Nov.2003 22:40 (EET)
7.Nov.2003 03:00 (EET)
-Company-
Nokia
Stora Enso
UPM-Kymmene
Metso
Analyst: Henry Nurminen, +358 10 236 4709
henry.nurminen@mandatum.fi
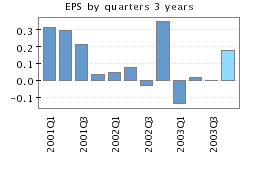
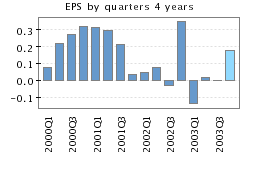
EARNINGS BY PERIOD
2002Q1
2002Q2
2002Q3
2002Q4
2003Q1
2003Q2
2003Q3
2003Q4e
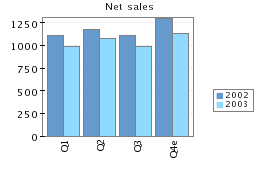
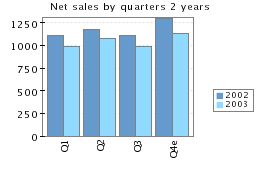
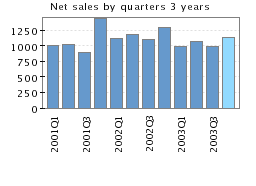
* Net sales
1111.0
1178.0
1105.0
1297.0
983.0
1072.0
991.0
1129.0
Metso Paper
456.0
446.0
453.0
617.0
412.0
456.0
415.0
540.0
Metso Automation
151.0
155.0
149.0
167.0
126.0
132.0
120.0
130.0
Metso Minerals
436.0
518.0
427.0
438.0
383.0
433.0
412.0
404.0
Metso Ventures
95.0
85.0
86.0
108.0
81.0
76.0
63.0
75.0
Intra-group sales
-27.0
-26.0
-10.0
-33.0
-19.0
-25.0
-19.0
-20.0
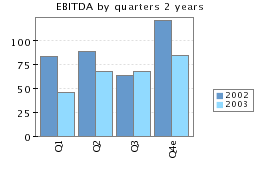
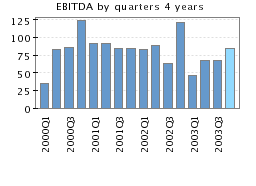
* EBITDA
83.6
88.9
63.5
121.0
45.8
67.4
67.5
84.0
Depreciation
-52.7
-46.3
-50.0
-48.0
-47.0
-46.0
-47.0
-46.0
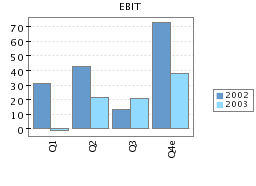
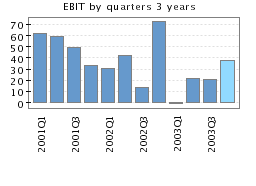
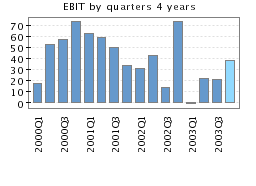
* EBIT
30.9
42.6
13.5
73.0
-1.2
21.4
20.5
38.0
Metso Paper
29.2
18.3
10.7
51.1
4.1
10.0
13.4
25.4
Metso Automation
-0.7
6.8
5.6
4.6
1.0
6.2
7.4
5.2
Metso Minerals
9.0
19.6
7.1
15.7
0.7
11.3
8.8
9.7
Metso Ventures
-0.1
7.3
-1.7
9.4
1.5
4.3
-2.9
3.8
Metso HQ and others
-6.5
-9.4
-8.2
-7.8
-8.5
-10.4
-6.2
-6.0
Net financial items
-17.0
-20.5
-17.5
-19.0
-18.0
-17.0
-18.0
-17.0
* Pre-tax Profit
13.9
22.1
-4.0
54.0
-19.2
4.4
2.5
21.0
Taxes
-7.0
-11.0
0.0
-6.0
0.0
-1.0
-4.0
3.0
Minorities
-1.0
-1.0
0.0
0.0
0.0
-1.0
1.0
0.0
* Net earnings
5.9
10.1
-4.0
48.0
-19.2
2.4
-0.5
24.0
Net sales growth %
10.9%
15.8%
24.6%
-9.7%
-11.5%
-9.0%
-10.3%
-13.0%
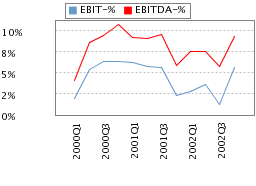
EBITDA %
7.5%
7.5%
5.7%
9.3%
4.7%
6.3%
6.8%
7.4%
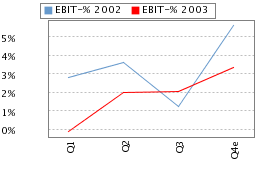
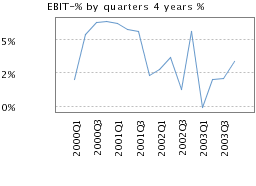
EBIT %
2.8%
3.6%
1.2%
5.6%
-0.1%
2.0%
2.1%
3.4%
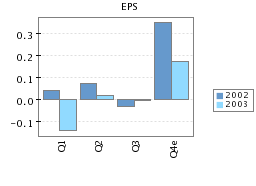
EPS (adj)
0.04
0.07
-0.03
0.35
-0.14
0.02
-0.00
0.18
Cumulative
2002Q1
2002Q2
2002Q3
2002Q4
2003Q1
2003Q2
2003Q3
2003Q4e
* Net sales
1111.0
2289.0
3394.0
4691.0
983.0
2055.0
3046.0
4175.0
Metso Paper
456.0
902.0
1355.0
1972.0
412.0
868.0
1283.0
1823.0
Metso Automation
151.0
306.0
455.0
622.0
126.0
258.0
378.0
508.0
Metso Minerals
436.0
954.0
1381.0
1819.0
383.0
816.0
1228.0
1632.0
Metso Ventures
95.0
180.0
266.0
374.0
81.0
157.0
220.0
295.0
Intra-group sales
-27.0
-53.0
-63.0
-96.0
-19.0
-44.0
-63.0
-83.0
* EBITDA
83.6
172.5
236.0
357.0
45.8
113.2
180.7
264.7
Depreciation
-52.7
-99.0
-149.0
-197.0
-47.0
-93.0
-140.0
-186.0
* EBIT
30.9
73.5
87.0
160.0
-1.2
20.2
40.7
78.7
Metso Paper
29.2
47.5
58.2
109.3
4.1
14.1
27.5
52.9
Metso Automation
-0.7
6.1
11.7
16.3
1.0
7.2
14.6
19.8
Metso Minerals
9.0
28.6
35.7
51.4
0.7
12.0
20.8
30.5
Metso Ventures
-0.1
7.2
5.5
14.9
1.5
5.8
2.9
6.7
Metso HQ and others
-6.5
-15.9
-24.1
-31.9
-8.5
-18.9
-25.1
-31.1
Net financial items
-17.0
-37.5
-55.0
-74.0
-18.0
-35.0
-53.0
-70.0
* Pre-tax Profit
13.9
36.0
32.0
86.0
-19.2
-14.8
-12.3
8.7
Taxes
-7.0
-18.0
-18.0
-24.0
0.0
-1.0
-5.0
-2.0
Minorities
-1.0
-2.0
-2.0
-2.0
0.0
-1.0
0.0
0.0
* Net earnings
5.9
16.0
12.0
60.0
-19.2
-16.8
-17.3
6.7
EBITDA %
7.5%
7.5%
7.0%
7.6%
4.7%
5.5%
5.9%
6.3%
EBIT %
2.8%
3.2%
2.6%
3.4%
-0.1%
1.0%
1.3%
1.9%
EPS (adj)
0.04
0.12
0.09
0.44
-0.14
-0.12
-0.13
0.05