These are sample pages! In real pages data is updated every day.
Valuatum main web page
Research Database
NOK1V.HSE
Recommendation
Accumulate
Risk
-
Target price
15.5
Share price
15.16
Company Views -
Nokia
Estimates updated
Price updated
Page generated
Older estimates
17.Oct.2003 12:18 (EEST)
6.Nov.2003 23:00 (EET)
7.Nov.2003 03:01 (EET)
-Company-
Nokia
Stora Enso
UPM-Kymmene
Metso
Analyst: Erkki Vesola, +358 10 236 4712
erkki.vesola@mandatum.fi
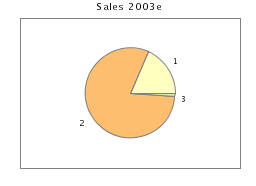
Sales per division
2000
2001
2002
2003e
2004e
2005e
1. Networks
7714.0
7534.0
6539.0
5338.1
5556.4
5928.7
2. Mobile Phones
21887.0
23158.0
23211.0
23455.7
25503.5
27214.0
3. Others
854.0
585.0
459.0
360.0
378.0
450.0
4. Internal
-79.0
-86.0
-193.0
-143.0
-146.4
-178.5
Total
30376.0
31191.0
30016.0
29010.8
31291.5
33414.3
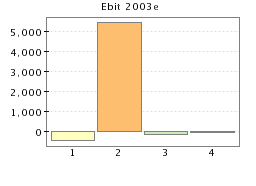
Ebit per division
2000
2001
2002
2003e
2004e
2005e
(Ebit margin)
1. Networks
1400.0
1073.0
416.0
-432.0
342.3
613.0
18.1%
14.2%
6.4%
-8.1%
6.2%
10.3%
2. Mobile Phones
4897.0
4648.0
5293.0
5428.7
5674.7
5792.3
22.4%
20.1%
22.8%
23.1%
22.3%
21.3%
3. Others
-307.0
-327.0
-59.0
-143.0
-10.0
45.0
-35.9%
-55.9%
-12.9%
-39.7%
-2.6%
10.0%
4. Internal
-129.0
-157.0
-230.0
-75.0
-145.0
-175.0
163.3%
182.6%
119.2%
52.4%
99.1%
98.1%
Total
5861.0
5237.0
5420.0
4778.7
5862.0
6275.3
19.3%
16.8%
18.1%
16.5%
18.7%
18.8%
Sales growth
2000
2001
2002
2003e
2004e
2005e
1. Networks
36.0%
-2.3%
-13.2%
-18.4%
4.1%
6.7%
2. Mobile Phones
66.0%
5.8%
0.2%
1.1%
8.7%
6.7%
3. Others
-14.2%
-31.5%
-21.5%
-21.6%
5.0%
19.0%
4. Internal
1.3%
8.9%
124.4%
-25.9%
2.4%
21.9%
Total
53.6%
2.7%
-3.8%
-3.3%
7.9%
6.8%
Growth in Ebit
2000
2001
2002
2003e
2004e
2005e
1. Networks
29.4%
-23.4%
-61.2%
-203.8%
-179.2%
79.1%
2. Mobile Phones
58.0%
-5.1%
13.9%
2.6%
4.5%
2.1%
3. Others
12.5%
6.5%
-82.0%
142.4%
-93.0%
-550.0%
4. Internal
0.0%
21.7%
46.5%
-67.4%
93.3%
20.7%
Total
50.0%
-10.6%
3.5%
-11.8%
22.7%
7.1%