|
You have reached an old page that is no longer updated in this location.
You will be redirected to a new page automatically.
Please update your bookmarks!
If the redirect doesn't work for some reason,
please continue to the new
location.
Freelance Analysis Step-By-Step Guide -
How to make analysis with prefilled Valuatum Excel model
Note! This document describes the process of doing
analysis in practice. If you are interested in freelance
analysis in general, please see
 Freelance introduction
Here below are listed the individual steps you need to
do in producing research with our system.
- Registration 3 minutes
- Choosing a company (company reservation)
2 minutes
- Find Information about companies for
the analysis 3 minutes
- Different tools to save the analysis
1 minute
- Basics of the Excel model 3
minutes
- DB2Excel - Copy
company data from database
(prefilled excel model)
- Doing estimates in practise
25 minutes
- Long-term estimates 5 minutes
- Analysis is ready - How to put
it into Database 3
minutes
- Justifying your estimates
15 minutes
- Filling out company background
info 2 minutes
- Analysis is ready for the public
eye - Ask for feedback 3 minutes
- Continuous analysis (updating
numbers and comments)
- Year change and model updating
Numbers behind each step are rough estimates how much
each step would take your time if you are efficient and
do not pump into any problems. First time users, especially
if they have not done analysis before, are likely to use
much more time especially during steps 2-5 and 8.
1. Registration
The first thing to do on the way in becoming a freelance
analyst is filling the registration form and uploading
your CV. After you have registered, you will be forwarded
to the analyst main page which will be the starting point
of your future analyst career.
Click
here to register as an analyst
2. Choosing a company (company reservation)
|
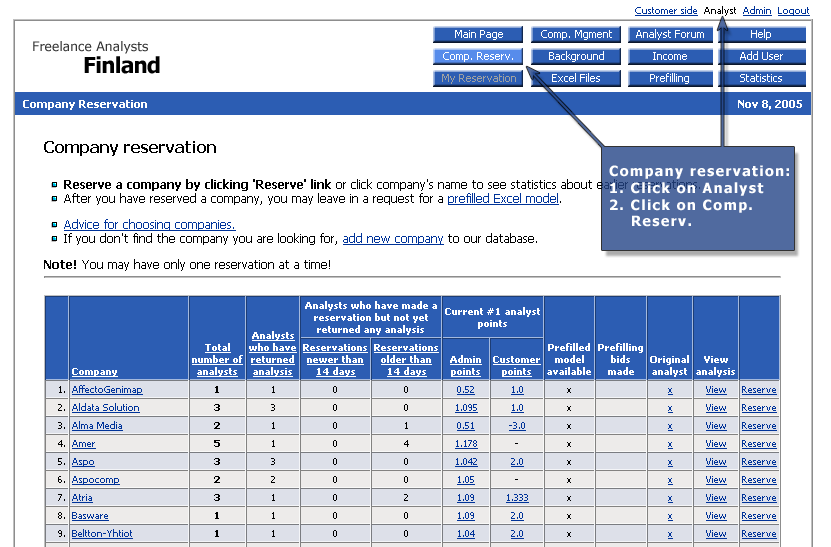
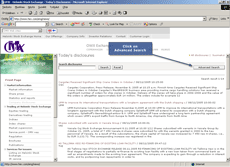
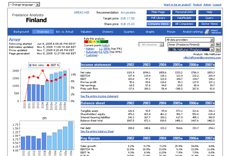
Next you have to choose a company on which to do
analysis. This is done by using the company reservation
system accessible from the analyst main page (see
picture 2.1). Here
are some advice in choosing companies.
It is possible for an analyst to analyse more than
one company at a time, but further companies can
be reserved only when the analysis on the first
company reservation is ready and in the database
(of course you can also cancel your reservation
and reserve another company). When you have reserved
a company, you will be provided with the Excel model
needed for doing the analysis.
|

Picture 2.1 - Click picture for
full-size.
|
3. Find information about companies
Where to get information about companies?
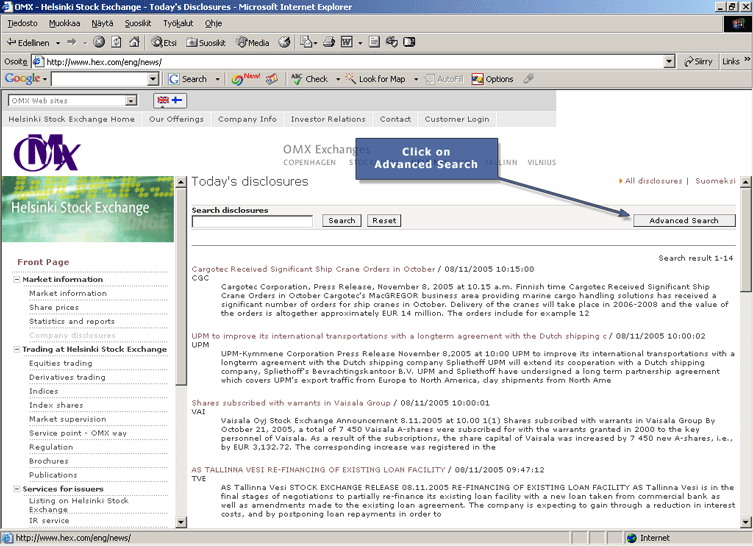
The easiest and often also the best source of information
is company stock exchange releases. E.g., from all
Finnish companies, you can find all the releases
at Helsinki
stock exchange www-site.
- Click advanced search and you can search
database easily by companies. See pictures 3.1
and 3.2.
- Open the company's latest financial report
to know what happened in the last period.
- Read also the Outlook for future.
More
information sources.
|
Picture 3.1 - Click picture for
full-size.
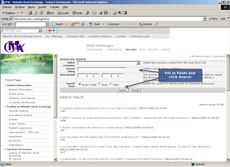
Picture 3.2 - Click picture for
full-size.
|
At this point you probably rush to read the stock exchange
releases from the company you have selected to analyse.
And as you read those releases, you kind of start analysing
the company. Therefore we would like to say a few words
about what is important in the analysis, even though these
things are originally written for instructions for the
phase where you start to change the estimates (phase 6).
So we recommend that you read this text already now before
reading the company disclosures:
Focus
on these things in your analysis
Future estimates are probably the
most important thing in analysis, and you should
really put effort in them. First you should concentrate
in the short-term estimates. The basis for the short-term
estimates is the current situation in the company: the
management guidance, cyclical situation, as well as
analyst's own assessment of the competitive situation
and market. You should also try to find out what other
market participants and research providers think of
the company's future: The
difference between your view and the consensus is crucial
for the pricing of the company and you should always
comment on it - if only there are consensus easily
available for your target company. In Valuatum Platform
there usually is consensus available for 3/4 of all
companies, so you have about 75% change to find consensus
estimates really easily.
It is also highly recommended that you start writing
down all the observations about estimates and reasons
behind them. Just open notepad or MS Word (or some similar
program) and write down important things. You can use
these comments later when you are writing your forum
messages, thus, they will definitely not be a waste
of time. We also strongly recommend that you
read instructions
about forum comments and commenting your estimates
before you determine what your short-term estimates
are. Reading first forum comment instructions and knowing
what kind of notes you should do, it is easier to make
useful notes while contemplating your estimates
Management guidance. Management has, or at least
should have, the best view how things are going and
developing in the company. This does not mean management
guidance would always be accurate. However, if you decide
to go against guidance in your own estimates, you should
have very good reasons to do so, and you should also
tell them to others (in forum comments). You can also
check how reliable management guidance has been in the
past. If guidance has been too optimistic (or too pessimistic)
in the past, you should take this into account (and
let others know about it - they can't read your mind).
Remember also that the company's situation changes all
the time; e.g. if the guidance made by the management
is not going to be fulfilled, the management has to
publish this information without delays.
Order book and its development. If the company
operates in a field where order book is relevant and,
thus, it reports it, then order book and its development
can help you to form a picture how things are developing
in your company. The importance of order book is very
different among companies; however, it is still worth
studying if it is available. See how order book has
developed and compare that with net sales. How have
they correlated in the past? And what is more important,
what can you expect to happen to net sales in the future
quarters based on current reported order book?
In addition, one more small thing with which you can
easily spoil otherwise good analysis: remember also
to take into account the
seasonal variation of sales and ebit.
4. Different tools to save the analysis
There are three tools to save the analysis:
- Excel model (the most comprehensive
one)
- Browser model
(quick and easy to use)
- ValuModels
(somewhere between those two, requires Java Runtime
Enviroment)
For a comprehensive analysis, we recommend you to
use the Excel model for which
you find instructions below.
The browser model
may be useful in some special occasions. First of all
you can use it from any computer with internet connection:
e.g. in internet cafe anywhere in the world without any
access to Microsoft Excel. With browser model is might
also be easy to start analysis for the first time. Then
there has be a good enough analysis from the chosen company
already in the database as you can not (at least currently)
fill in all the historical parameters with browser model.
ValuModels
is somewhere between Excel Model and Browser model: it
is more comprehensive than browser model and more easy
to use than Excel model as everything is in the same window
and quarter and divisional level can easily be accessed
in "tree-structure". Furthermore you can change
any level in sales and ebit (group, division, quarter
and any of their combinations) as the model has formulas
to each direction: from bottom up as well as top-down
allocation. However, ValuModels has also its weaknesses:
it runs on java (requires Java Runtime Environment in
your computer) and it is sometimes unstable and might
fall dawn and then you lose your numbers (you must save
your work often if you use ValuModels to change your estimates).
5. Basics of the Excel model
Opening the Excel model
Open your Excel model just like any other Excel
workbook. Model includes some macros. Excel might
warn you about them, but when you just click "enable
macros" the model should open without problems
(see picture 5.1).
In some cases you might also pump into "Circular
reference" -problem announcement when opening
the Excel model. Put iteration on to avoid that.
More
info behind this link.
|
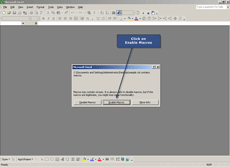
Picture 5.1 - Click picture for
full-size.
|
DB2Excel (from DataBase To
Exce) is a tool that enables you to copy
all the historical (and estimate) data from any
other company/analyst from Valuatum database to
your Excel model. So it enables you to start
with prefilled model and you should absolutely
use it as there is no sense that you would
input all the historical data that has been inputted
already by some other analyst. Click
here for more detailed instructions about how
to use DB2Excel.
Starting WITHOUT prefilled
numbers
Some more experienced analysts might also need
our Empty Excel-Model
Step-By-Step Guide. It is especially needed
if you cannot obtain prefilled model but instead
you have to input even all the historical numbers
by yourself. Empty
Excel-Model Step-By-Step Guide is also more
detailed than this document so also other analysts
might find help for some problematic situations
from there.
|
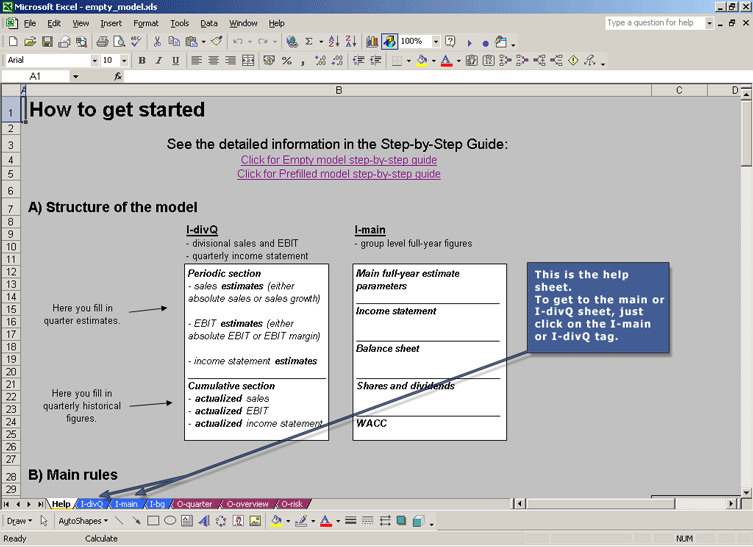
What sheets are used?
Once you have opened the Excel model, you should
see something like picture 5.2 in front of you.
This is the help sheet of the model. To get to the
other sheets, click on the sheet names on the lower
bar (see picture 5.2). Sheets that actually are
important to you right now are I-main (picture
5.3) and I-divQ (picture 5.4) (I stands for
input).
|
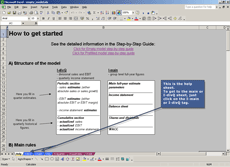
Picture 5.2 - Click picture for
full-size.
Picture 5.3 - Click picture for
full-size.
Picture 5.4 - Click picture for
full-size.
|
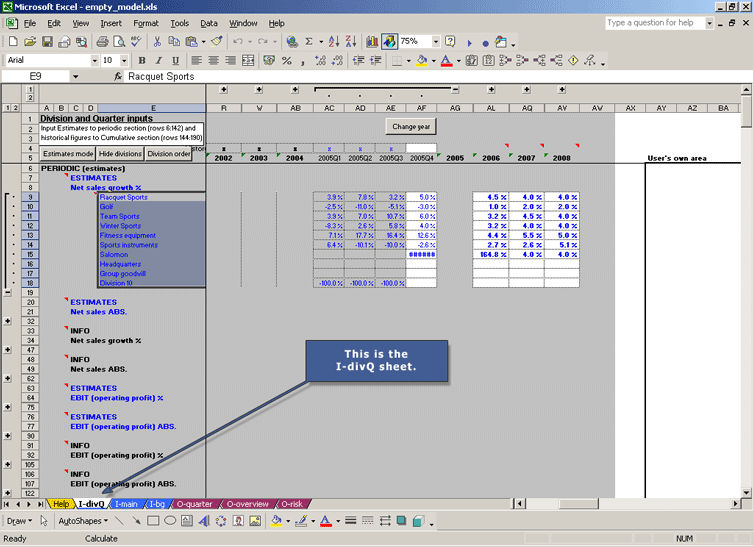
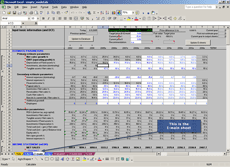
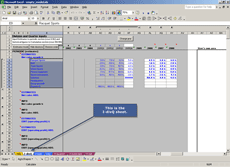
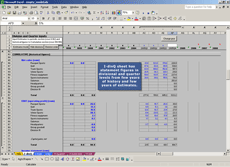
Information on the sheets
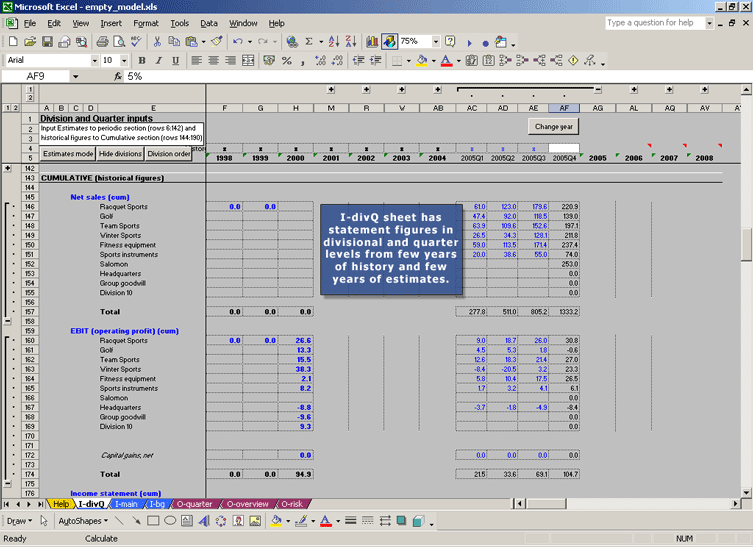
I-divQ sheet (see picture 5.5) has income
statement figures in divisional and quarter levels
from few years of history and few years of estimates.
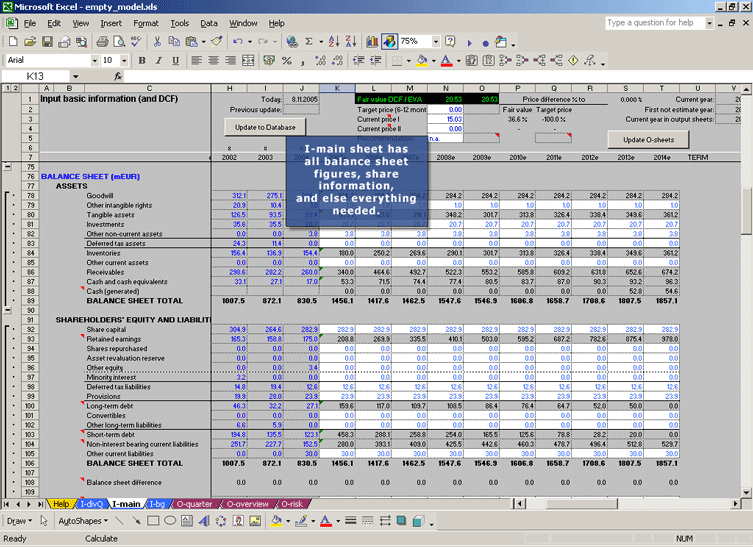
All the other information can be found in
I-main sheet (see picture 5.6). There
you can find all balance sheet figures, share information,
long-term estimates (both income statement and balance
sheet), and everything else needed.
|
Picture 5.5 - Click picture for full-size. |
Output sheets
You can also browse information at output sheets
like O-quarter and O-overview, but
remember that you are not allowed to change anything
on output sheets. All changes to figures must
be done at input-sheets: I-divQ and I-main.
|

Picture 5.6 - Click picture for
full-size.
|
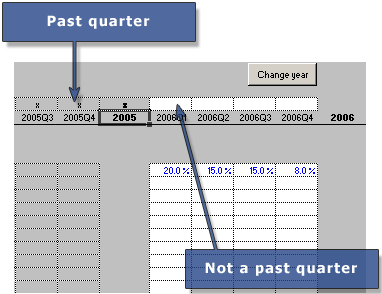
Past figures at I-divQ sheet
All the quarters where the numbers have already
been reported has to marked as passed (with "x"
in row 4 as shown in the picture 5.7). With past
quarters the actual figures are inputted in cumulative
section beginning from row 147.
So check the row 4 at I-DivQ-sheet and see whether
all the historical quarters are marked as passed
quarters (Picture 5.7).
E.g. if the interim report for Q1 has already been
published, the column for Q1 estimate figures should
be marked as passed with an x mark and the background
color should be gray.
If the interim report of the first quarter in white
- has not been published, you can continue to
the next chapter.
- has been published, do the following:
- Change the quarter (or year).
See instructions.
- Update cumulative figures (Picture 5.8)
|
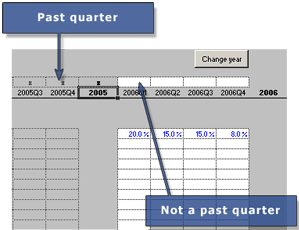
Picture 5.7 - Click picture for
full-size.
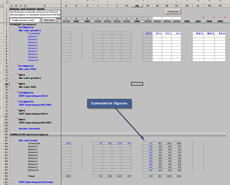
Picture 5.8 - Click picture for full-size.
|
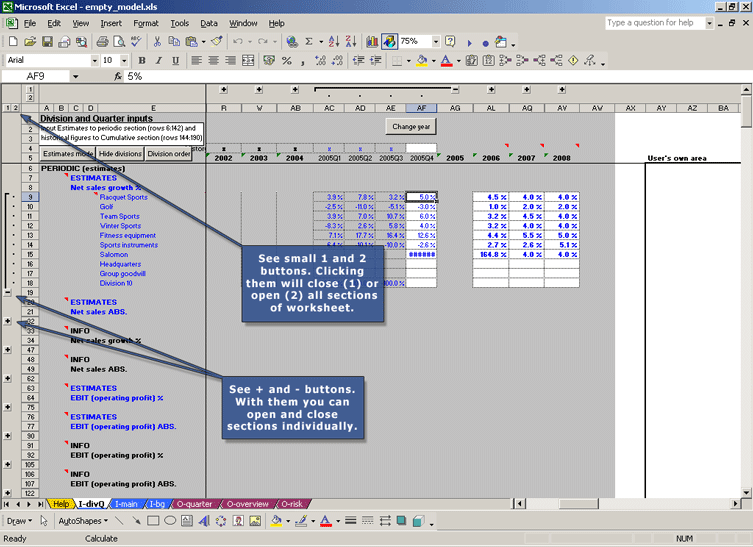
Hiding and unhiding rows
You can open and close different parts of workbook
by clicking + and - signs on the left side and on
the upside (see picture 5.9) in the I-divQ sheet.
You can also press 1 or 2 in the left up corner.
1 will close all sections and 2 will open all of
them. It is handy to keep all the other information
out of sight that you are not processing; thus,
it helps you a lot if you start to use the Excel-file
with these +/- signs.
|
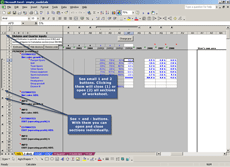
Picture 5.9 - Click picture for full-size. |
Important rules
You are allowed to
Enter and change values in the (input) cells that
are with blue font color.
Attention!
You are NOT allowed to
- change any formulas in the output cells
that are
in black font
- remove or add any rows or columns (you
can however hide them)
If you need to do own calculations that need space,
then you can also add own sheets and make links
from them to the input cells. But never add rows
to current sheets of Valuatum Excel model like I-main
and I-divQ.
So, the
key rule is that change only blue input cells,
not black output cells.
Enter all absolute numbers in millions (of euro
for example).
More information about Valuatum Excel model can
be found from Excel
manual and Empty
Excel model step-by-Step tour (Empty
Excel model Step-By-Step tour is meant for analysts
who do not get prefilled Excel model but have to
start with empty Excel model as no-one else has
followed the company before that they are going
to follow. That help document is, however, much
more detailed than this document and thus also prefilled
model users might get some help from it.)
|
6. Doing estimates in practise
Do you already know what is most important in doing short-term
estimates? If you do, then please proceed, but if you
do not please get back to chapter 3 where the most
important things in analysis were described.
Read the latest company result announcement and/or annual
report once more and then change the estimates as you
think they should be changed:
What figures to estimate
The most important figures to estimate are
- EBIT (operating profit)
- Net sales
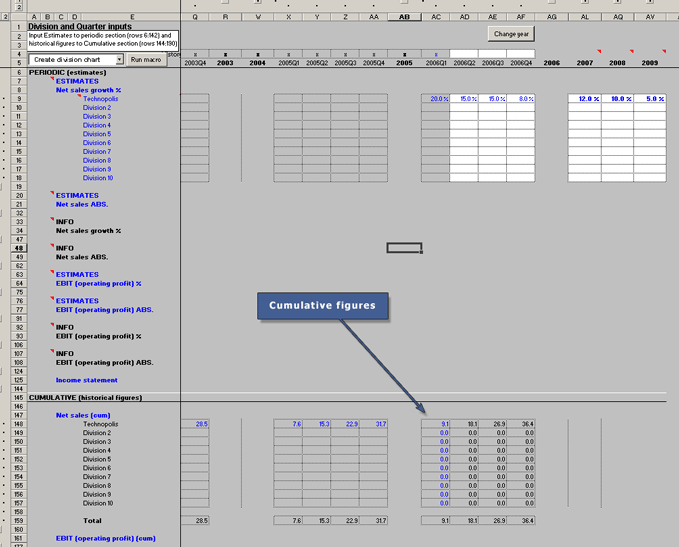
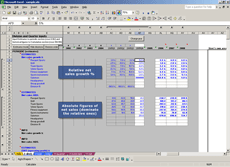
Where to input the estimates
The near-future estimates are done in the I-divQ
sheet. There you will find the divisional information
by quarters (see picture 6.1).
Input estimates in the white cells with blue font.
Making changes to the model
While thinking your estimates you will get a lot
of help from division
graphs -macro. Especially seasonal
variation is easy to take into account with
the graphs.
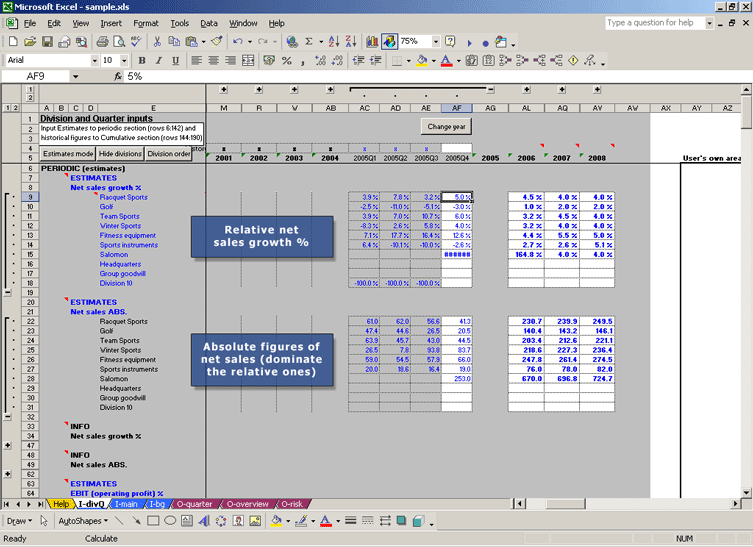
The future estimates can be done with absolute
or relative numbers. You can put absolute figure
of net sales to ESTIMATES Net sales ABS and relative
net sales growth %. Let's say, you believe that
your company's one division will have a rise of
15 % in net sales in Q4 of the current year (see
picture 6.2). Just put 15 % to Q4 of that division.
You can also input your estimates as absolute figures.
Thus, if you believe that net sales will be 150
million euros in Q4 of the current year, simple
put the number 150 to Q4 sector of this division.
However, you need to remember one thing:
Absolute figures dominate the relative ones.
This means that if you, or someone else, has
filled in both an absolute figure (150 millions
in this example) and a percentage (15%), then the
percentage becomes unrelevant, and it no longer
matters what in the growth % (15 % in this example)
is as the absolute figure (150 mEUR) dominates.
Remember: all
changes must be done with figures in blue font.
Do not change, e.g., the info fields in black font.
INFO fields
You will also find INFO fields on i-DivQ
-sheet. They are only informative as they gather
different estimate paths together: you can change
an estimate either in absolute terms or with percentages
and the quarter in question might already be in
the past and then the real historical values are
inputted in the cumulative section. Therefore it
is practical that we have info fields where the
real and uninterrupted series of both past figures
and estimates is shown. And that is why we have
INFO fields. You must not input anything to INFO-fields
(as you see they are in black font) so if you would
like to change estimates, you use periodic estimate
fields (above the info fields) and if you have to
change historical figures, then change the cumulative
figures on the bottom of the sheet.
Make other estimates
In the similar way you can make your own estimates
about EBIT of the company. There is also a possibilty
to use absolute figures or relative ones (EBIT%).
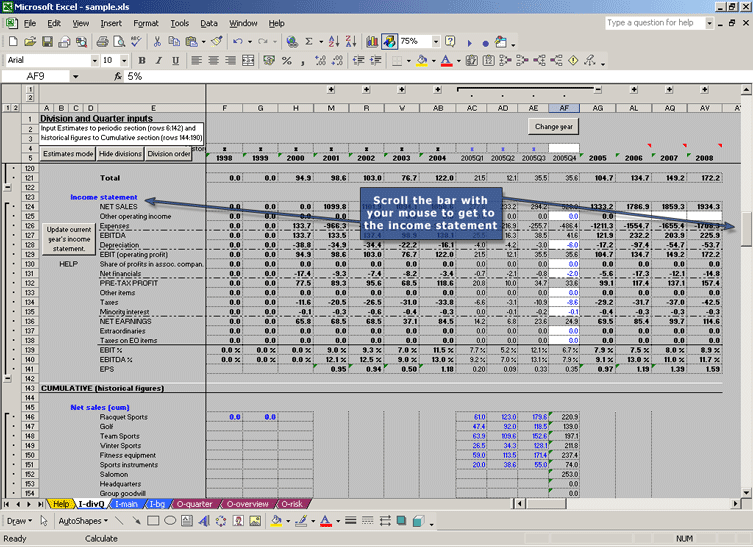
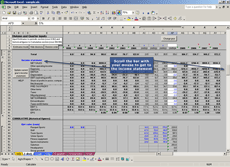
After EBIT move along to the income statement (see
picture 6.3). When you have done all future estimates
(in I-divQ sheet you should make them current year+three
years ahead) for these three (net sales, EBITs and
income statement), you are ready to move along to
the I-main page.
Inputting history figures and changing quarter
As you probably have current prefilled Excel model,
you do not have to update the model by inputting
e.g. quarter figures in past quarters (you only
have to check that they have been inputted correctly
by the analyst whose model you use). However, sooner
or later, as time passes, you have to input also
past quarter-figures. They are inputted in cumulative
section and not in periodic section as estimates.
More
info about changing quarter or year can be found
behind this link.
Updating previous quarter
It is possible that you have received such a prefilled
excel-model where not all historic quarters are
updated. In that case you have to input the old
historical figures. A tutorial for it will be published
later on here. In case you need the instructions
now, please contact
Valuatum.
|
Picture 6.1 - Click picture for
full-size.
Picture 6.2 - Click picture for
full-size.
Picture 6.3 - Click picture for
full-size.
|
7. Long-term estimates
7.1 Background of long term estimates
The basis for the long-term estimates should be the long-term
growth of the sector in general. More
information about all long-term estimates can be found
behind this link.
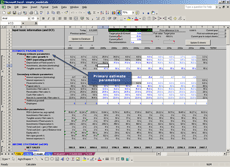
7.2 Preparing long-term and other estimates
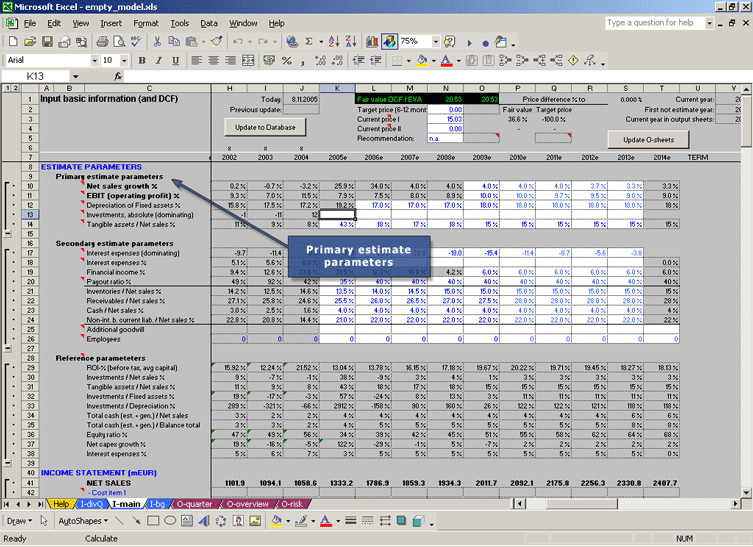
Primary estimate parameters
Right in the beginning of the main sheet you will
find the primary estimate parameters (see Picture
7.1). You have filled some of them (net sales and
EBIT %) already in I-divQ sheet until 2008, but
other estimates should be done here: as you see
from the font colours, they
must not be changed here (otherwise the links would
be destroyed). Many of these figures, like investments/tangible
assets have a big influence on DCF / EVA
fair value, so keep them realistic. Normally you
can make pretty good estimates based on the historic
values. If your companies situation has not changed
significantly, estimates shouldn't do that either.
Secondary estimate parameters and balance sheet
Most of the secondary estimate parameters are connected
to the balance sheet. Again it is natural to keep
things in a certain level. Secondary
estimate parameters inlude working capital items
so e.g. inventory, receivables and non-interest
bearing debt.
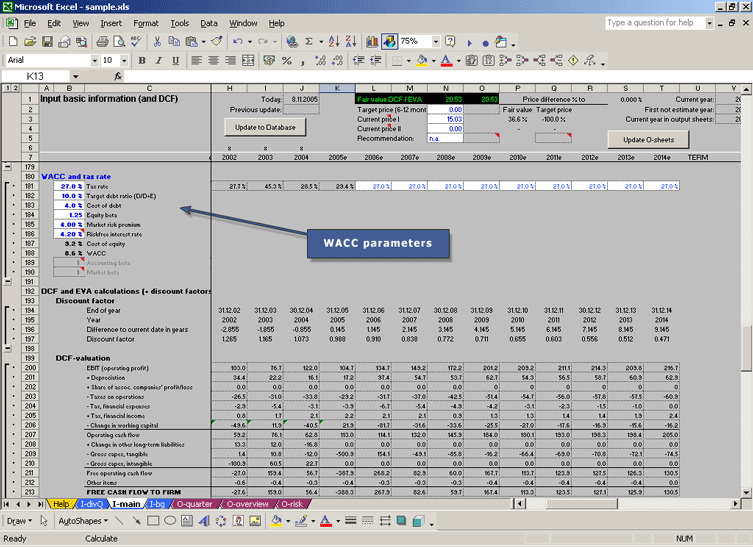
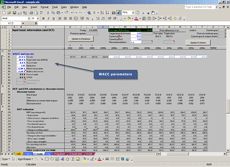
Weighted Average Cost of Capital (WACC)
WACC (see Picture 7.2) also is an important factor
in the estimates especially when calculating DCF
/ EVA fair value. Instructions
about the WACC parameters can be found here.
|
Picture 7.1 - Click picture for
full-size.
Picture 7.2 - Click picture for
full-size.
|
8. Analysis is ready - How to put it into the database?
Preparations for your PC
You may have to do couple of things before you
can update your analysis to the database:
i) Setup Java Runtime Environment (JRE) to your
PC (you probably have it already).
ii) Download Valuatum files that are needed to run
the Excel2DB process.
More information
can be found behind this link.
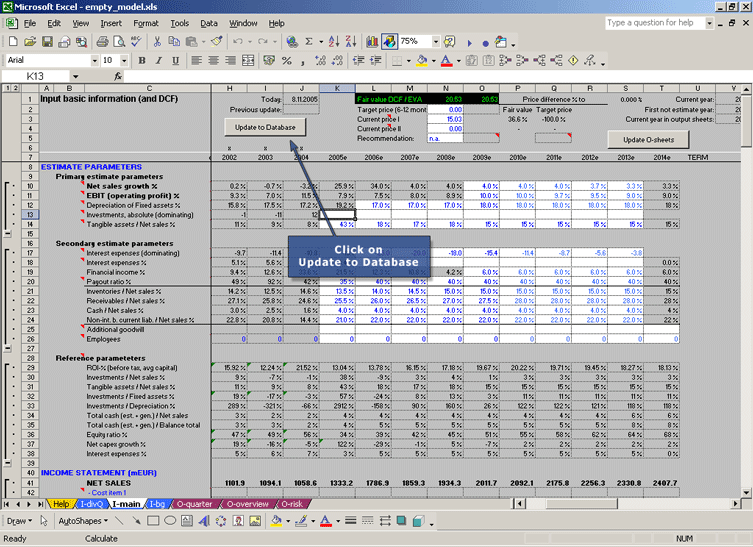
Update analysis to database
After you have filled the Excel model with your
estimates, you can put it to the database over the
internet with only one click. "Update to the
database" button is located in the main page
(see picture 8.1).
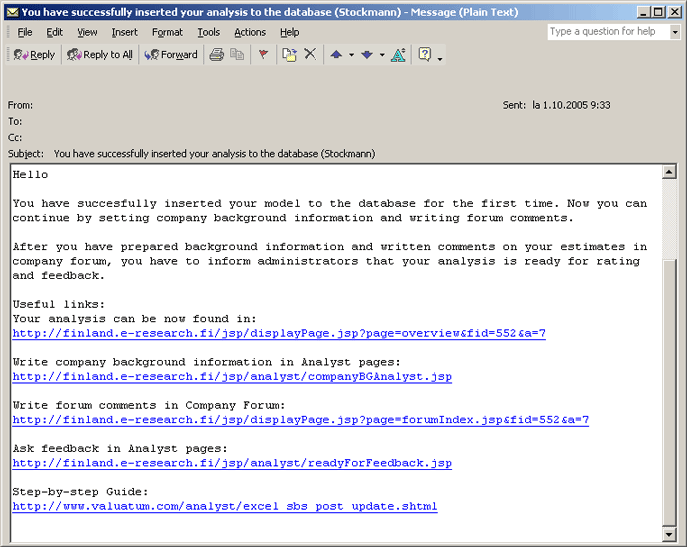
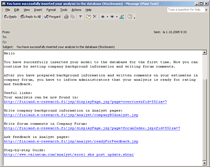
You will receive an email
In this email you will find a link (see picture
8.2). Use this link to open your analysis from the
database. Note that your analysis is not yet shown
anywhere in the freelance analysis pages - You cannot
get there in any other way than using this link.
Use it to open your analysis.
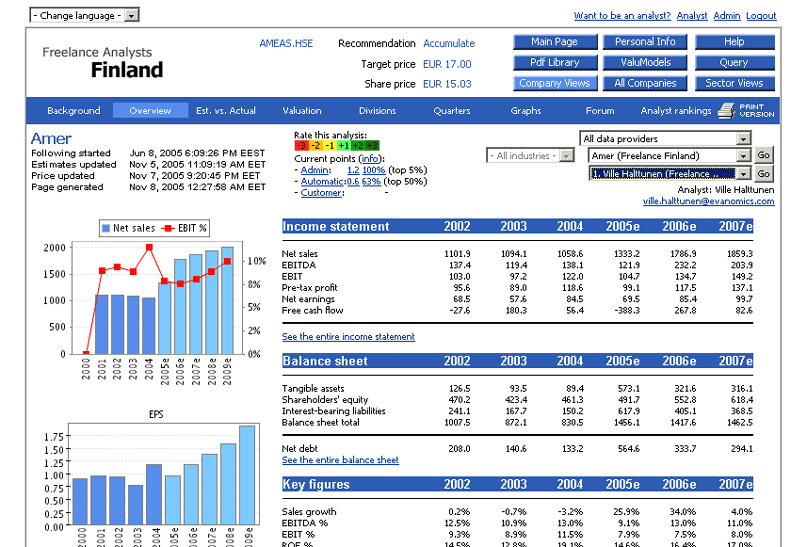
Open your analysis with the link
Now your analysis is in your screen as it would
be shown to a customer (see picture 8.3). You should
check your figures and estimates once more, because
now they are shown in more graphical and illustrative
way. You might also want to think about the valuation
of your share again. When everything is good, move
on to next phases.
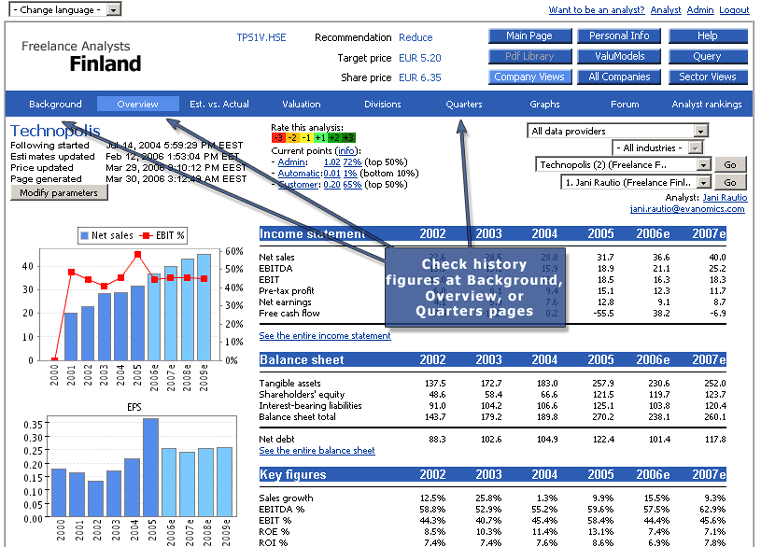
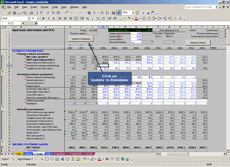
Check historical information
Check the historical data. You have probably made
your analysis based on data that other people have
gathered and prepared. Nevertheless, you are responsible
for all the figures in your analysis. This means
you have to check the historical data, especially,
if the old analyst of the company in question (whose
figures you use) is not among the best analysts
according to the admin points. The following figures
are the most important ones and should be checked
by everyone at least for last few years. They can
be found at either Background, Overview, or Quarters
pages in Company views pages in the system. (Picture
8.4)
Number
of shares (Background)
Net
sales (Overview & Quarters)
EBIT
(Overview & Quarters)
EPS
(Overview & Quarters)
Balance
sheet total (Overview)
If figures are not correct, see Excel
manual.
Att: you can ask us to do first database update
if you encounter any problems
About 5-10% of our analyst encounter some problems
when they try to put their first analysis into the
database. So far all of these problems have been
solved, but in some cases it takes some time to
solve the problems (by us at Valuatum). Thus there
should be some quick way for the analyst to pass
these problems and go on with the analysis.
The solution for this is: if
you encounter any problems then you can always send
the excel-file to
us by e-mail and we put it into the database.
It requires only one press of a button at our side
and thus takes about 5 seconds by us and thus it
is no problem if we have to do this couple of time
on behalf of you. In one case (in 2006 first half)
an Argentinian analyst sent all the excel-models
to us for about 6 months as her own old Portugalian
excel-version did not run our macros. The case was
finally solved so that we send her new excel-licences
|
Picture 8.1 - Click picture for
full-size.
Picture 8.2 - Click picture for
full-size.
Picture 8.3 - Click picture for
full-size.

Picture 8.4 - Click picture for full-size.
|
9. Justifying your estimates
Justify your estimates
Now that you are sure about your estimates and
the reasons behind them, it is time to explain them
to the others. This is extremely important. At this
point it should be clear to you why your estimates
are as they are. Hopefully you followed the instuctions
and took notes already when doing the estimates.
Remember that others cannot read your mind
- If you haven't explained it in the forum, there
is no way people could guess that you have thought
about it when preparing your estimates. And use
graphs along with your comments as
instructed below.
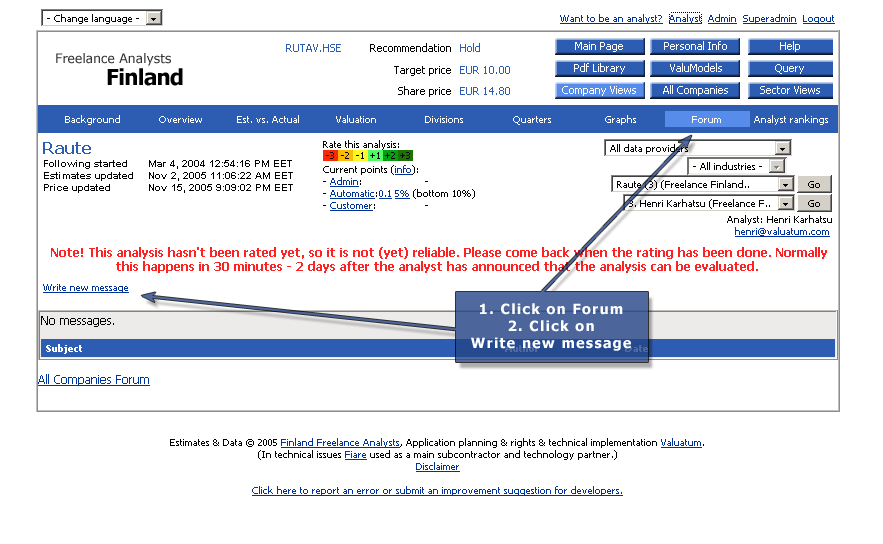
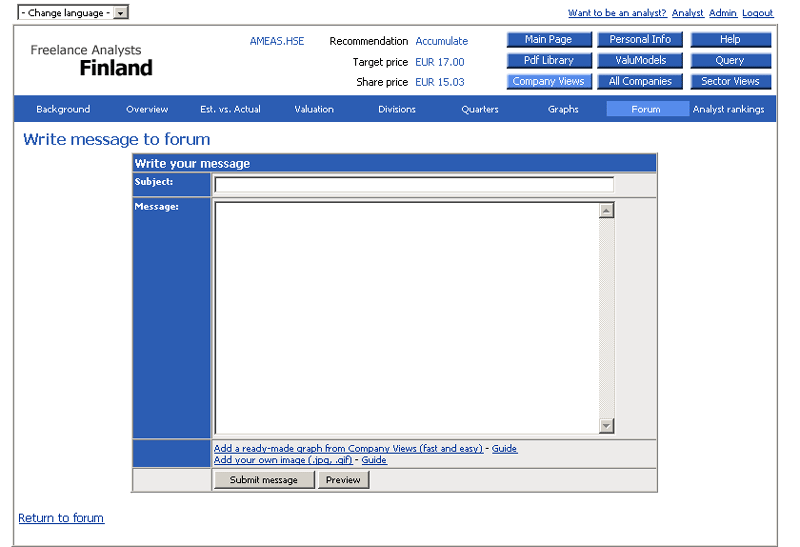
How to write forum comments?
Technically writing messages is very simple. You
can find forum messages below each analysis page.
Just press Write a new message (see Picture 9.1)
and then the message page on the right will open
up (see Picture 9.2).
What kind of message should I write?
Forum messages
should explain and justify your estimates.
To do this you should be able to tell all the relevant
things you have thought about while doing estimates.
You should also tell how your estimate are relative
to management
guidance and to consensus estimates (if available).
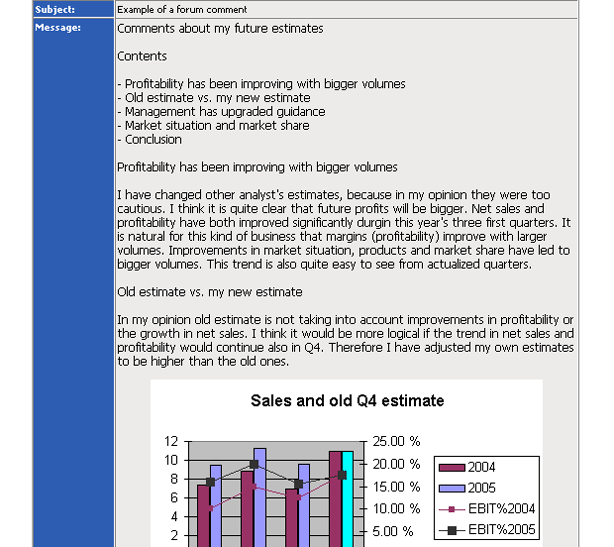
Use graphs
It is recommended to use also graphs with your
forum comments (see Picture 9.3). They make your
text much easier to read and with them it is much
easier to make grounds for your estimates. As you
e.g. describe how the past financial performance
has been and what you have estimated for the future
quarters and years, it is very recommended to use
graphs between your text.
It is very easy to insert graphs from your company
views -pages. And it is also not too difficult
to insert images
from your own.
Look at examples from current top analysts
To get a better picture about forum messages, you
can easily find good examples of them. You can go
Analyst rankings page and see what the top
analysts have done. Press "View"-link
to look at the ones with best admin points and you
should have a good idea what the good messages could
include and look like. Analyst rankings page can
be found behind a link in customer main page. In
upright corner there is a link "All Companies".
Put mouse over it, and new selections will open
up. Choose the last one, Analyst rankings.
|
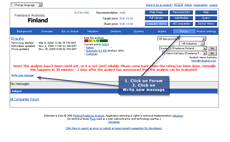
Picture 9.1 - Click picture for
full-size.

Picture 9.2 - Click picture for
full-size.
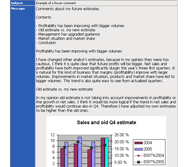
Picture 9.3 - Click picture for
full-size.
|
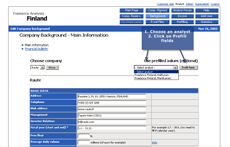
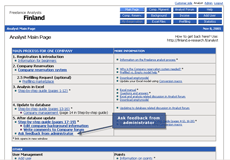
10. Filling in company background info
Where should I fill in the background info?
When you see your analysis in the screen, in the
upright corner you see link "analyst".
Choose that and the analyst page will open in front
of you.
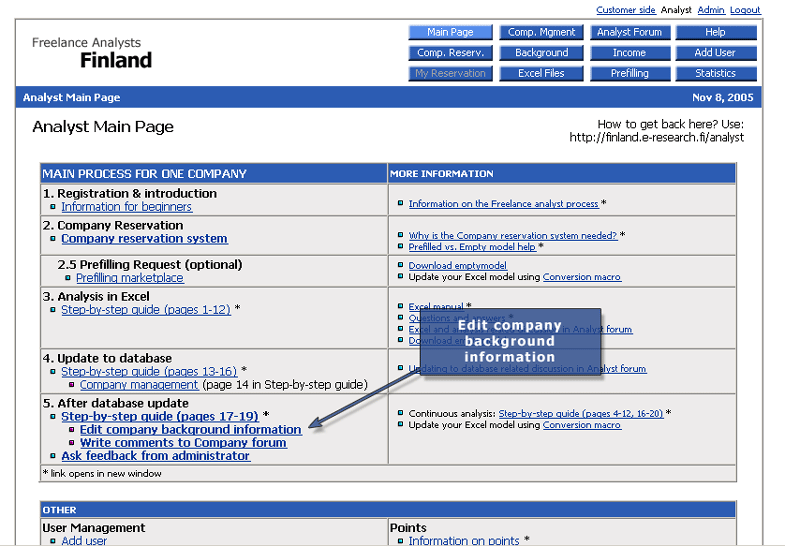
Now you can see link called "Edit company
background info" below chapter 5 (see picture
10.1). Choose that and you will come to the page
where you should see your company. There is also
selection between Main information and Financial
bulletin. You have to fill them both.
Financial bulletin is very important for automatic
analysis update watcher: if you have not filled
in the financial bulletin dates (or if your analysis
is unupdated for over one week after some quarter
result) then automatic processes are going to rank
your analysis as "non-current".
Using prefilled background info
You can use already made prefilled background info
that other analysts have filled before you (if there
has been analyst before you).
You can "auto-fill" this information
pressing "Use prefilled values", selecting
the analyst whose information you want to use and
pressing "Prefill fields" (see picture
10.2). All the prefilled information will now appear
to the fields. Remember to check information. It
is likely that some information needs updating.
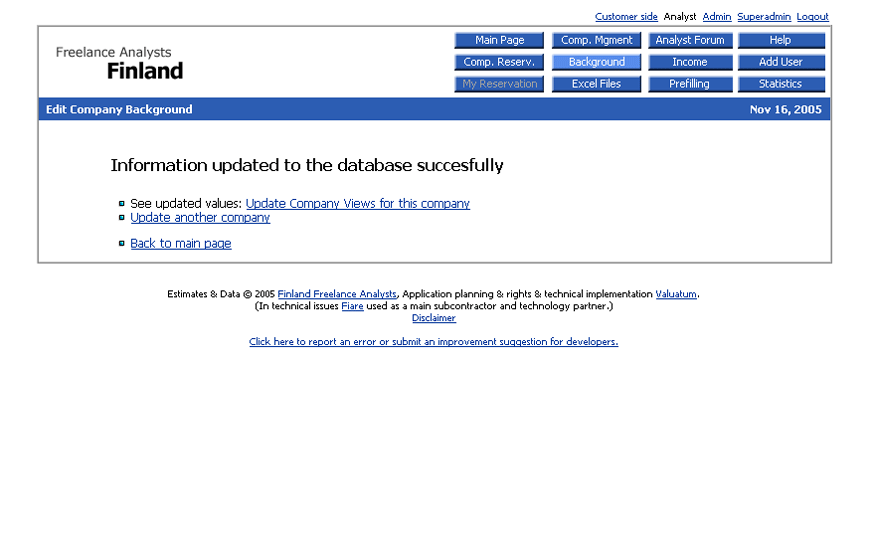
When the Main information is done, save it by clicking
"Update information" in the end of the
page. By doing so, you will arrive to a page seen
in picture 10.3. You can click Update Company Views
for this company and information will come to your
analysis. You can see the information clicking Background
in the next page.
After this, fill in the Financial bulletin
in a similar way.
A rare situation, when the company hasn't announced
the dates the financial information will be released,
may occure. Then you have to approximate the releasing
date, and make a clear comment in to the backround
page and to the forum that these dates are not announced
by company, but they are approximated by you according
to the information you have. After the company announces
the date, you can update the dates and delete the
comments.
|
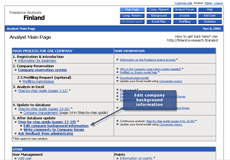
Picture 10.1 - Click picture for
full-size.
Picture 10.2 - Click picture for
full-size.

Picture 10.3 - Click picture for
full-size.
|
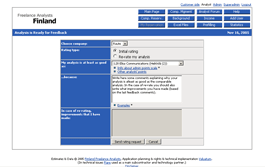
11. Analysis is ready for the public eye - Ask for feedback
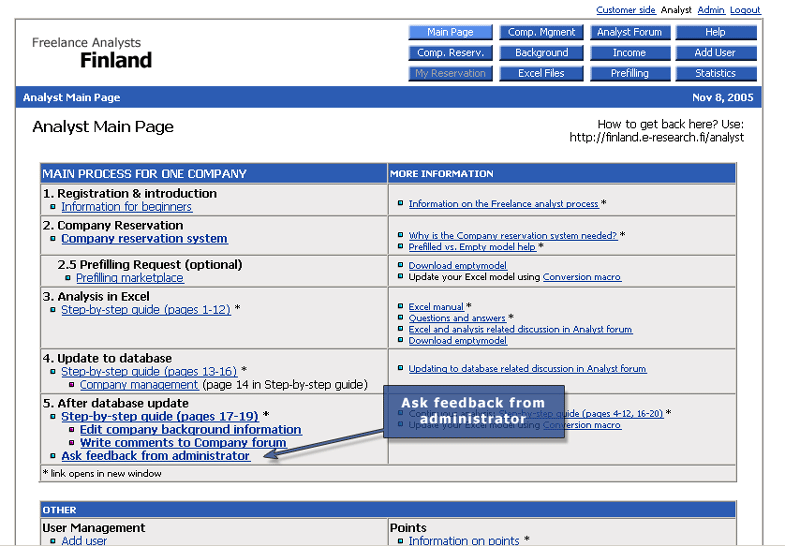
Where should I ask for feedback?
You should ask for feedback when your analysis
is ready to be rated. Asking for feedback happens
through Analyst pages (see picture 11.1). There
you will find a link called "Ask for feedback
from administrator". You will arrive to a page
that you can see in picture 11.2.
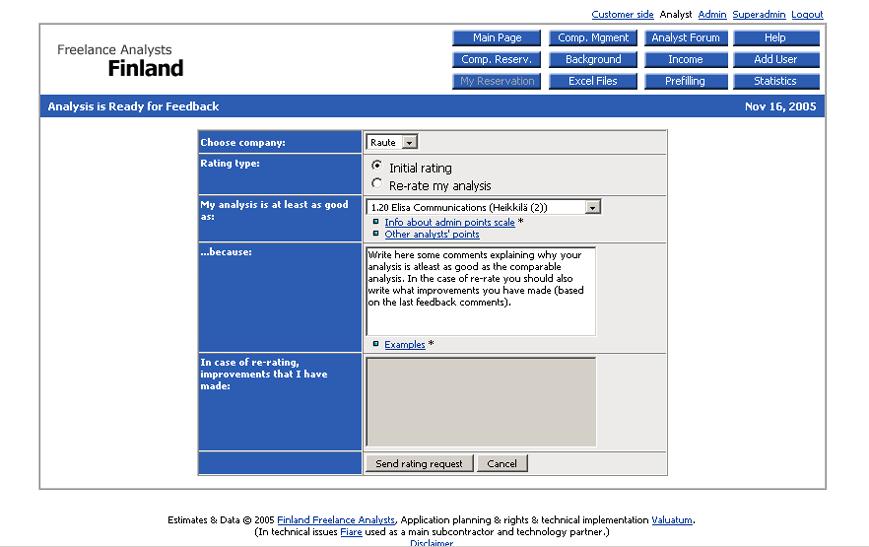
Asking for feedback
You have now the page on the left in front of you.
First select the company your want to be graded
from the list. Choose initial rating if it is the
first time this company is being rated. Otherwise
choose re-rate my analysis. Then choose a "comparison
analysis": Analysis you think is about the
same quality as your analysis. If you think selecting
one is difficult, just choose one with points you
think you at least deserve. Write some comments
explaining why your analysis is at least as good
as the comparison analysis. In the case of re-rate
you should also write what improvements you have
made (based on the last feedback comments). Do not
ask feedback via email, because it causes difficulties
in the system.
Finally you will receive an email
When your analysis has been rated, you will receive
an email. In this email you will find points you
received, comments about your analysis and improvement
suggestions. There will also be a link, which will
lead you to points page. There you can compare your
points with others.
What does feedback cost?
Your first feedback request will be free but each feedback
request for the same company after
that will cost you 10 euros out of your analyst incomes. More information about feedback request fees
|
Picture 11.1 - Click picture for
full-size.
Picture 11.2 - Click picture for
full-size.
|
12. Continuous analysis (updating numbers and comments)
After the first update and the preparations involved
with it, you do not have to spend much time anymore with
the model itself: it is very fast (couple of minutes)
to
update the historical numbers with each quarter and
it also goes quickly to update the future estimates when
needed.
Most of the time thereafter goes to the most essential
things: Assessing the company´s capabilities, competitive
situation, future demand, changes in environment and how
all these things together shape the future financial performance
of the company. And you should not only think these things
by yourself but put these thoughts to company forum as
arguments for your analysis.
As your analysis becomes good enough, you will start
to get revenues for it. We have written an introduction
on rewarding principles.
You may also find instructions on how
to get the collected rewards paid.
13. Year change and model updating
Finally a few special things that you should remember
in the long-run when you do your analysis:
Year change after annual report
When the company publishes an annual report (usually
in February-March), you should change the year in the
Excel model.
Instructions
for Year change (in Excel manual)
Some
background information about Year change (in Product
section)
Updating your Excel model to the latest version
We continuously update the Excel model and try to make
it better. When you would like to update your model to
the latest version, you can do it with the following instructions:
Instructions
for updating Excel model
Other things
Splits and stock issues must be adjusted in the excel-model.
That is very easy and fast to do (takes about one minute)
if you only know what has to be done in the model:
How
to adjust share splits in the Excel-model
You can perhaps find help related to starting the analysis
also from:
Advice
for doing estimates and commenting them (Recommended!)
Analyst Main Page (most important
links related to starting the analysis)
Valuatum Excel Model Questions
& Answers
Valuatum Excel Model Manual
(detailed instructions)
Freelance Intro pages
(General info about freelance analysis)
Helping links (Contact
information and links to different pages that you may
find useful)
|